IELTS Academic Writing Task 1 Topic 20: Changes in spending habits of people in UK – Graph


Limited-Time Offer : Access a FREE 10-Day IELTS Study Plan!
Write a report to a university lecturer describing the data.
Write at least 150 words.
Report Plan
Paraphrase: shows>demonstrate; spending habits>spending patterns
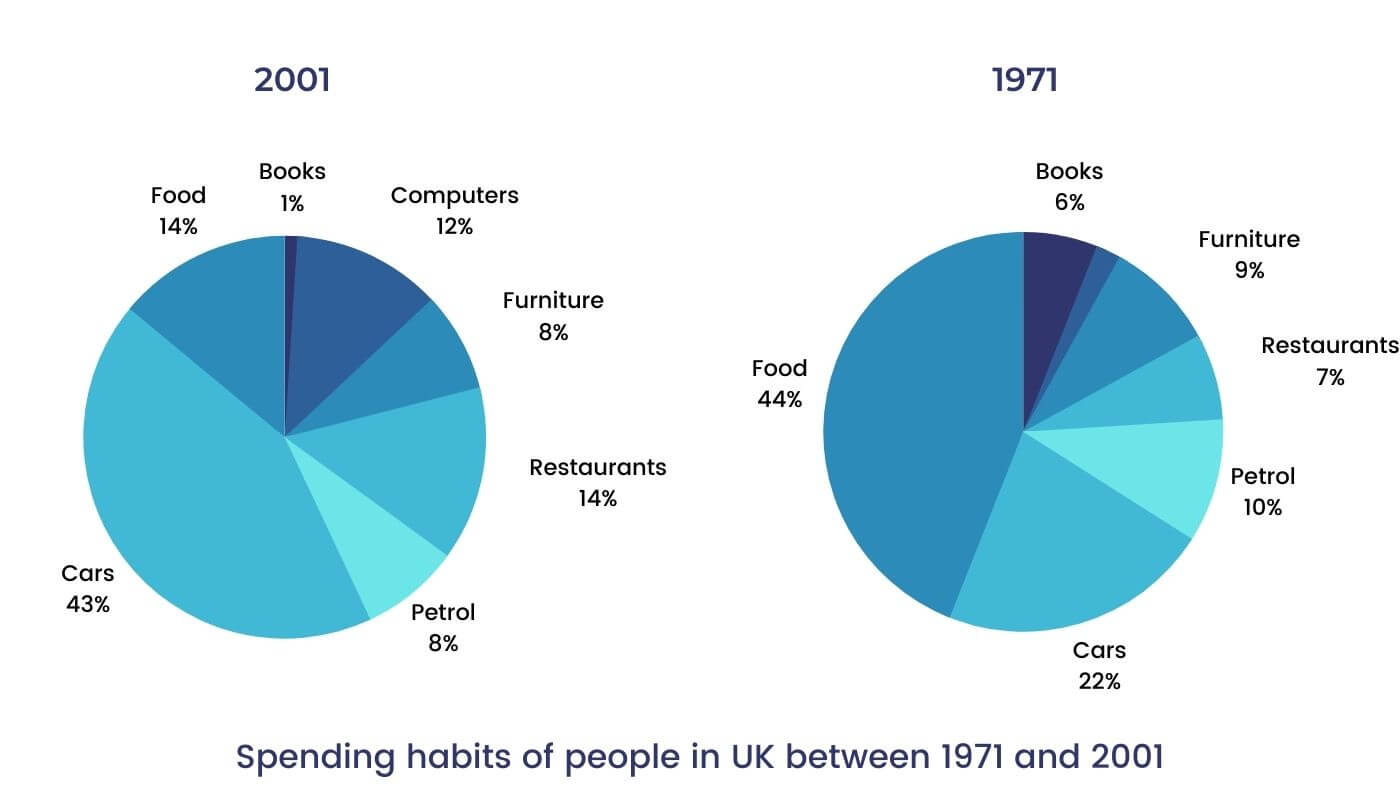
Overview: The graphs show changes in spending habits of people in UK between 1971 and 2001.
Paragraph 2: (1) Compare the expenses on different commodities. Give figures.
Paragraph 3: (1) Compare the expenses on different commodities. Give figures.
Sample Answer
The pie charts demonstrate changes in the spending patterns between 1971 and 2001 in the UK.
The overall trend shows an increased amount of money spent on cars, computers and eating out.
Talking about it in detail, food and car turned out to be the two biggest items of expenditure in both the given years. Together, they encompassed more than half of household spending in the UK. In 1971, food accounted for 44% of the expenditure. In 2001, it saw a drop by two thirds and reached up to 14%. Also, the spending on cars turned twice, increasing from 22% to 43%.
Significant change can be seen in other areas as well. Outlay on eating out doubled, climbing from 7% to 14%. A dramatic increase in the proportion of salary spent on computers can also be observed, up from 2% to 12%. However, with a striking upsurge in computer expenditure, the percentage of expenditure on books plunged from 6% to 1%.
Get evaluated for FREE!
Got a quick report in your mind for this question. Don’t hesitate to post the same in our comment section. We will evaluate the report/letter and email you the band score & our trainer’s comments. And, this service is entirely free.
Also check:
Practice IELTS Writing Task 1 based on report types

Start Preparing for IELTS: Get Your 10-Day Study Plan Today!

Explore other sample Pie Charts
Janice Thompson


Post your Comments
6 Comments
naveen
Posted on Sep 12, 2023
The graphs compare the variation in expenditure by citizens of u.k in various sectors from 1971 to 2001.
Overall, it is clear that the income spent on Food, Cars, and Petrol was the highest in 1971, whereas, in 2001, the spending on Cars, Computers and eating out increased.
According to the diagrams, people in the UK spent a large proportion of money on food and cars in both years. In 1971, food accounted for 44% of overall spending. In contrast, in 2001, it substantially decreased to 14% of total expenditure. There was a significant change in cars as the amount spent on them increased from 22% in 1971 to 43% in 2001.
The proportion of restaurant spending doubled from 7% to 14% in 1971 and 2007, respectively. The figures for petrol and furniture were 10% and 9% in 1971, slightly dropping to 8% in 2001. The expenses made by people in the UK on computers upsurged from 2% to 22% for the given 30 years. However, with the rise in spending on computers, the outlay on books
Reply
kavita Timbadia
Posted on Sep 13, 2023
Band 5.5
The response focuses on the requirements of the task and an appropriate
format is used.
(Academic) Key features which are selected are covered and adequately
highlighted. A relevant overview is attempted. Information is appropriately
selected and supported using figures/data.
The response focuses on the requirements of the task and an appropriate
format is used.
Organisation is evident but is not fully
logical and there may be a lack of overall
progression. Nevertheless, there is a
sense of underlying coherence to the
response.
The resource is generally adequate and
appropriate for the task.
The range of structures is limited and
rather repetitive.
For further detail evaluation . You can avail a Free trial class
Find the link below:
https://ieltsmaterial.com/signup-1/
Carolina
Posted on Jan 26, 2022
The pie charts illustrate changes in spending patterns of the UK’s populations in two years, 1971 and 2001.
Overall, it can be observed that food was the most significant sector people spent money on in 1971, while cars accounted for most of their spending thirty years later. The most dramatic change can be seen on the food sector which has shown a fall of 30 per cent of people’s spending during this time frame.
Also worth noting is that cars spending increased by just over a fifth and people spending habits on computers also demonstrated a growth of approximately 10%. Restaurant spending comprised of 7% in the first year and this figure doubled in 2001.
In contrast, all the other categories showed a decreased in its proportions; apart from food which had a substantial fall, the other sectors, books, petrol and furniture, showed only a minimal change by 5%, 2% and 1% respectively from 1971 to 2001.
Reply
Carol
Posted on Jan 25, 2022
The pie charts illustrate changes in spendings patterns of the UK’s populations in two years, 1971 and 2001.
Overall, it can be observed that food was the most significant sector people spent money on in 1971, while cars accounted for most of their spendings thirty years later. The most dramatic change can be seen on the food sector which has shown a fall of 30 per cent of people’s spendings during this time frame.
Also worth noting is that cars spendings increased by just over a fifth and people spending habits on computers also demonstrated a growth of approximately 10%. Restaurant spendings comprised of 7% in the first year and this figure doubled in 2001.
In contrast, all the other categories showed a decreased in its proportions, apart from food which had a substantial fall, the other sectors, books, petrol and furtniture, showed only a minimal change by 5%, 2% and 1% respectively.
Reply
Janice Thompson
Posted on Jan 27, 2022
Band score: 5
Concentrate on prepositions, articles, pronouns.
Kishan
Posted on Dec 23, 2016
Hi
Could you please send me the all the IELTS (academic) material related to January 2017 test regarding writing material for task 1 and task 2 both place sent me…
My email:- patelkishan26194@gmail.com
Reply