Composition Of Household Rubbish In The United Kingdom – IELTS Writing Task 1
5 min read
Updated On
-
Copy link

Limited-Time Offer : Access a FREE 10-Day IELTS Study Plan!
In IELTS Writing Task 1 of the academic section, there will be a visual representation like ‘Composition Of Household Rubbish In The United Kingdom’ on which you have to write a report.
An IELTS pie chart is a graphical/pictorial illustration of a cycle or a sequence of events that occur in a process. To describe a pie chart, you are expected to observe it and explain the sequence provided in it. You are scored based on your comprehension of the process chart, the way you explain it, the aptness of the vocabulary, and the construction of the sentences with good grammatical usage.
Let’s now have a look at the pie chart – ‘Composition Of Household Rubbish In The United Kingdom’ – with three expert-curated sample answers for different IELTS band scores ranging from band 7-9!
Question
The pie charts below give information about the composition of household rubbish in the United Kingdom in two different years.
Summarise the information by selecting and reporting the main features, and make comparisons where relevant.
You should write at least 150 words.
Structure Breakdown
| Question Type
Pie chart Introduction Paraphrase the prompt. Overview Summarize the main trends or patterns in the chart. Highlight the most significant or noticeable information. Main Body Paragraph 1 Present specific details about the key data points in the chart. Group similar data together and discuss the trends over the given time frame. Main Body Paragraph 2 Make comparisons between different categories or highlight similarities and differences. Use comparative language and conjunctions to enhance coherence. |
Band 7 Sample Answer For Writing Task 1 Pie Chart – ‘Composition Of Household Rubbish In The United Kingdom’
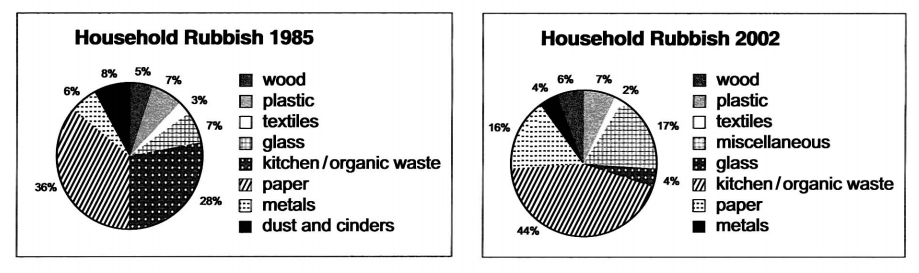
The different components of household rubbish in the United Kingdom in 1985 and 2002 are shown in the two pie charts.
Overall, the proportions of most categories of household waste remained similar from 1985 to 2002, but the two major changes were represented by increased kitchen /organic waste and reduced paper waste.
The percentage of kitchen/organic waste jumped from 28% in 1985 to 44% in 2002, representing the greatest increase in that time. In contrast, paper waste was significantly reduced from 36% in 1985 to 16% in 2002. The proportion made up of plastic waste remained the same in both years at 7%. Similarly, the percentages of wood and textile waste remained relatively stable at 5% (wood) and 3% (textiles) in 1985 and 6% and 2% in 2002 respectively.
The miscellaneous category which appeared in the 2002 pie chart did not feature in the 1985 pie chart. Also, the category of dust and cinders, which represented 8% of household rubbish in 1985, disappeared from the 2002 breakdown.
(153 Words)
Clear the IELTS Academic Writing Task 1 pie charts in no time with a band 9 now!
Sign up for a FREE demo
Band 8 Sample Answer For Writing Task 1 Pie Chart – ‘Composition Of Household Rubbish In The United Kingdom’
The pie charts show the percentages of household waste in the United Kingdom in the two different years 1985 and 2002 with eight categories representing different types of rubbish.
Overall it is evident that a fall in the percentage of most types of rubbish, while the proportion of kitchen/organic waste clearly increased over the years.
In the first pie chart, paper comprises the largest segment at 36% in 1985, followed by kitchen/organic waste at 28%. Additionally, metals and wood each accounted for 8%, while glass and plastic together make up 14%. Dust and cinders represent the smallest portion at 5%.
On the other hand, the second pie chart shows the replacement of dust and cinders with miscellaneous items in 2002. In this year, paper constituted approximately 16%, with kitchen/organic waste representing the largest amount at 44%. Furthermore, miscellaneous items account for 17%, while plastic and wood each make up to 7% and 6% respectively. Metals and glass combined amount to 8%, and textiles have the smallest proportion at 2%.
(173 Words)
Grab the latest IELTS Academic Writing test papers here!
Band 9 Sample Answer For Writing Task 1 Pie Chart – ‘Composition Of Household Rubbish In The United Kingdom’
The pie charts illustrate the composition of household rubbish in the United Kingdom in 1985 and 2002.
Overall, most components of household rubbish remained stable over the years, except for kitchen/organic waste and paper. Additionally, there were notable changes with respect to the disappearance of dust and cinders in the final year.
To begin with, in the year 1985, kitchen/organic waste made up to 28% of household rubbish, but this increased significantly to 44% by 2002. In contrast, paper waste decreased from 36% in 1985 to 16% in 2002, marking a substantial reduction. Moreover, Plastic waste accounted for 7% of household rubbish in both 1985 and 2002.
Similarly, wood and textile waste maintained stable percentages of 5% and 3% respectively in 1985. However, a noteworthy change occurred with miscellaneous items, which were not there in 1985 but constituted 17% of household rubbish in 2002. Additionally, dust and cinders, which accounted for 8% of household rubbish in 1985, were entirely absent from the 2002 data.
(166 Words)
Connectors Used in the Above Sample Answers of ‘Composition Of Household Rubbish In The United Kingdom’
Connectors, also known as connectives or transition words, are words or phrases that link ideas or parts of a sentence or paragraph together. Here are some of the connectors used in the above sample answers:
- Overall
- In the year
- To begin with
- Moreover
- Considering
- However
- While
- Overall it is apparent that
- Regarding
- Meanwhile
Remember to proofread your essay for grammar, vocabulary, and spelling errors. These tips, combined with practice, will help you write well-structured and coherent IELTS Writing Task 1 pie chart answers like ‘Composition Of Household Rubbish In The United Kingdom.’
Practice Writing Mock Tests with IELTSMaterial.com
If you are preparing for the IELTS Writing exam, we would recommend you practice tasks like the above given IELTS Writing questions regularly. The more you practice, the better you will become at cracking the writing tasks for IELTS within the dedicated timeframe.
You can also enrol in our IELTS preparation online classes to get your hands on the latest IELTS writing questions or participate in our free online webinars to learn how to write them directly from the IELTS experts!
Useful Links:
- Information on UAE government spending in 2000 – Pie chart
- Survey conducted by a university library – Pie chart
- The percentage of water used by different sectors – Pie chart
- Household expenditure of an average US family – Pie chart
- Use of public libraries in 1990 and 2000 in Britain – Pie chart
Also check :
Explore IELTS Writing

Start Preparing for IELTS: Get Your 10-Day Study Plan Today!

Explore other sample Pie Charts
Janice Thompson

Recent Articles
Kasturika Samanta
Kasturika Samanta
Kasturika Samanta

Raajdeep Saha


Post your Comments
2 Comments
sivareddymarella
Posted on Jun 2, 2022
The circle chart shows the statistics for household debris in the United Kingdom between 1985 and 2002.
The kitchen or organic waste increased from 28% in 1985 to 44% in 2002, showing that 16% of kitchen or organic waste was raised over the years. In terms of paper waste, it significantly reduced from 36% in 1985 to 16% in 2002, maybe by digitalisation. Furtherly, textile, wood, metal and glass waste has almost remained with a difference of +/- 2. Similarly, there is no change the plastic garbage; it was 7% in 1985 and 2002.
The dust and cinders percentage was 8% in 1985, and it disappeared in the 2002 pie chart. The miscellaneous percentage was 17 in 2002, and it did not appear in 1985 at all.
Overall, % of paper garbage declined, and kitchen or organic waste % inclined between 1985 to 2005.
Reply
Glen Brown
Posted on Jun 3, 2022
Band Score: 5
The word count is less than 150 words
Pay attention to verb forms