IELTS Writing Recent Actual Test (Task 1, 2) in January 2017 & Model Essays
Table of Contents

Try AI Essay Checker for Instant Band Score
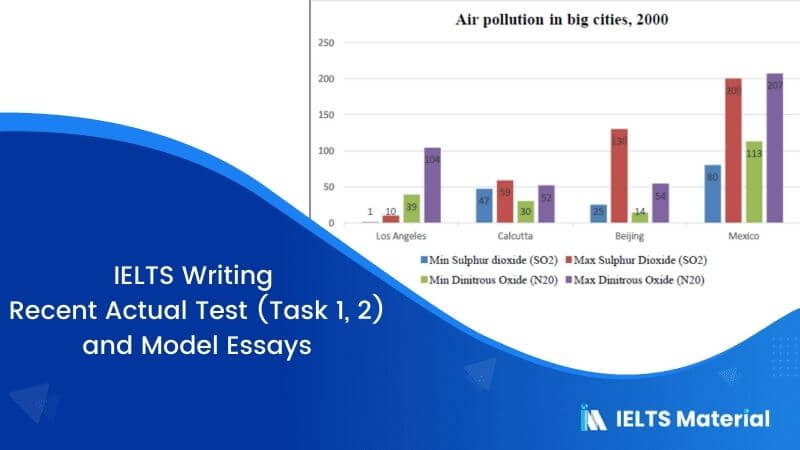
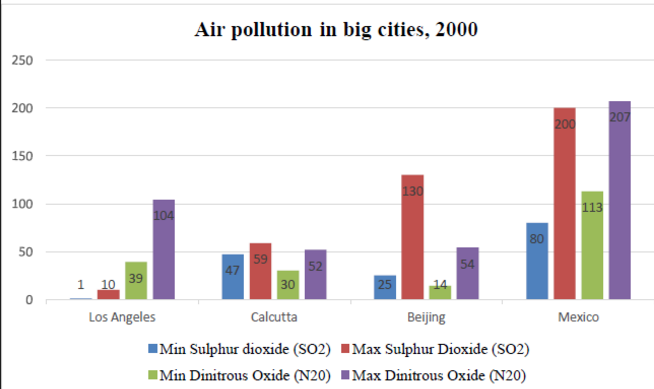
The chart below shows the average daily minimum and maximum levels of two air pollutants in four big cities in 2000.
Summarise the information by selecting and reporting the main features, and make comparisons where relevant.
Report Plan
Paragraph 2: (1) compare the numbers in different cities. Give figures.
Sample Answer
The chart compares the lowest and highest levels of Sulphur dioxide (SO2) and Dinitrous Oxide (NO2), which are two air pollutants, in four cities, such as Los Angeles, Calcutta, Beijing and Mexico, in 2000. Overall, the average presence of these polluting gases is higher in Mexico than in other cities.
As the graph presents, the Sulphur dioxide level in Los Angeles is from 1 to 10, which is significantly lesser than in other cities. The presence of this pollutant varies from 80 to 200 in Mexico, making it the highest. Calcutta recorded the minimum level of SO2, which is 47. On the other hand, Beijing recorded a minimum of 25, and the maximum went as high as 130, which is more than double in comparison to Calcutta. In contrast, the presence of Dinitrous oxide, which is the second air pollution material, could be found more in the air of Mexico City than others, as seen in the illustration. The minimum N2O level in Mexico is 113, which is approximately ten times more than that of Beijing, which in turn is four times higher than Calcutta and Los Angeles. Also, the upper level of N2O is more elevated in Los Angeles than in Calcutta and Beijing.
Also check :
Explore IELTS Writing

Start Preparing for IELTS: Get Your 10-Day Study Plan Today!
Recent Articles
Haniya Yashfeen

Kasturika Samanta


Post your Comments
2 Comments