Amount of Leisure Time Enjoyed by Men and Women of Different Employment Statuses - IELTS Bar Chart
4 min read
Updated On
-
Copy link
Check out the IELTS Bar chart question about “Amount of Leisure Time Enjoyed by Men and Women of Different Employment Statuses” and get exclusive access to a proper structure breakdown and sample answers! Hop on to read it!
Table of Contents
- How to Read an IELTS Bar Chart Effectively?
- Question on ‘Amount of Leisure Time Enjoyed by Men and Women of Different Employment Statuses’
- Report Plan
- Sample Answer 1 - Amount of Leisure Time Enjoyed by Men and Women of Different Employment Statuses
- Sample Answer 2 - Amount of Leisure Time Enjoyed by Men and Women of Different Employment Statuses
- Common Mistakes While Attempting an IELTS Bar Chart

Try AI Essay Checker for Instant Band Score
In the Academic section of the IELTS Writing Task 1, you may encounter visual representations like a Bar Chart. Just like a Line graph, an IELTS bar chart also comes with two axes, which show changes and categories within a given period of time. Moreover, a bar graph has rectangular bars that will be either displayed vertically or horizontally, and will represent two or more values of data.
Certain crucial aspects of an IELTS Writing Task 1 bar chart include the layout, the figures, the contrasts, and the similarities. Here we have a bar chart question on the topic - “Amount of Leisure Time Enjoyed by Men and Women of Different Employment Statuses,” which appeared in a previous IELTS test.
How to Read an IELTS Bar Chart Effectively?
- Reading an IELTS bar chart begins with checking the title and the given question statement, which tells you clearly what the given chart is entirely about.
- Then, you should look at the x-axis and the y-axis to understand all the categories and the units given.
- Always try to identify whether the values are in numbers, percentages, or any other unit.
- Check for the time period if the chart shows data across various years.
- Identify the highest and lowest values in the Bar chart since these usually form important points in your overview.
- Start comparing the given categories to see which ones are different, similar, higher, or falling.
Question on ‘Amount of Leisure Time Enjoyed by Men and Women of Different Employment Statuses’
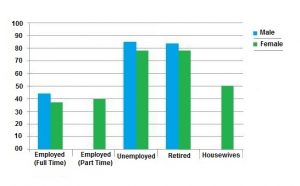
The chart below shows the amount of leisure time enjoyed by men and women of different employment statuses.
You should spend about 20 minutes on this task.
Write a report for a university lecturer describing the information below.
You should write at least 150 words.
Leisure time in a typical week in hour – by sex and employment status, 1998-99.
Report Plan
- Paraphrase: Paraphrase the topic sentence.
- Overview: Mention the main features of the bar graph and give an overview of the information provided.
- Paragraph 1: Elaborate on the pattern of leisure time enjoyed by men and women of different employment statuses.
- Paragraph 2: Elaborate on the pattern of leisure time enjoyed by men and women of different employment statuses.
Sample Answer 1 - Amount of Leisure Time Enjoyed by Men and Women of Different Employment Statuses
The bar graph depicts the different amounts of leisure time enjoyed by people of different employment statuses between 1998 and 1999.
The highest amount of leisure time was enjoyed by unemployed and retired people. Housewives enjoyed the second most amount of leisure time followed by part-time and full-time employees.
In terms of gender, males spent more time on recreation than females. The unemployed segment of the population spent the most time on recreation, which is more than 80 hours a week for males and a little less than 80 hours a week for females. The amount of time retired men and women spent on leisure activities was similar to that of the unemployed. Housewives spent 50 hours a week on leisure.
As for employed individuals, part-time women employees spent 40 hours a week on leisure. The same for full-time employees were more than 40 hours a week for men and less than 40 hours a week for women.
Sample Answer 2 - Amount of Leisure Time Enjoyed by Men and Women of Different Employment Statuses
The given bar chart shows the amount of leisure time enjoyed by people with different employment statuses over the time frame between 1998 and 1999. In an overview, the greatest amount of free time is shown among the individuals who were unemployed or retired, whereas the housewives had the second-highest count.
Firstly, a clear gender difference is seen across most categories. Men generally spent more time on leisure activities than women. Adding on, unemployed people enjoyed the most leisure time, with an average of men spending over 80 hours per week and the women category slightly below that count. Similarly, retired men and women showed a similar pattern, wherein they approached around 80 hours of leisure in a week.
The housewives category is a group composed exclusively of women and they have about 50 hours of free time every week, which places them clearly above the part-time and full-time employees. Among the employed individuals, the part-time female workers showed approximately 40 hours of leisure each week. On the other hand, all the full-time workers had even less free time. Women recorded a bit under 40 hours per week whereas, men enjoyed just over 40 hours in a week.
Common Mistakes While Attempting an IELTS Bar Chart
- An Overview before you begin
Most of the students forget to include an overview of the given trend, which is essential for a higher band score.
- Paraphrasing over copying
Some of the students just copy the task’s question instead of paraphrasing the question as the first line in their introduction.
- Picking out every number
Describing each and every number given instead of summarising the main features of the Bar chart will lower the band score.
- Meaningful Comparison
Students often compare unrelated categories instead of focusing mainly on the important trends and comparing them.
- Strictly No Conclusions
An IELTS Writing Task 1 in the academic section does not require the writer to write a conclusion. Hence, just comparing and highlighting a proper report of 150 to 170 words is sufficient.
Practice IELTS Writing Task 1 based on report types

Start Preparing for IELTS: Get Your 10-Day Study Plan Today!

Recent Articles

Nehasri Ravishenbagam


Nehasri Ravishenbagam

Kasturika Samanta


Post your Comments