IELTS Bar Charts: Types, Guidelines & Samples for Academic Writing Task 1
6 min read
Updated On
-
Copy link
This is the perfect article for you to write an IELTS bar chart essay, covering types of bar graphs, the structure of the essay, and tips for success. It also offers practice examples for preparation.
Table of Contents

Try AI Essay Checker for Instant Band Score
Among all the other types of questions, you will also come across a question that will showcase a bar graph. Also known as a bar chart, the bar graph is evaluated similar to a IELTS line graph. Such a bar chart also comes with two axes, showing changes and diversifications over a given period of time.
Moreover, the bar graph has rectangular bars that could be either displayed vertically or horizontally, representing two or more values of data.
Types of IELTS Bar Graphs
When preparing for the IELTS Writing exam, you would have to prepare for two different types of bar graphs: vertical and horizontal.
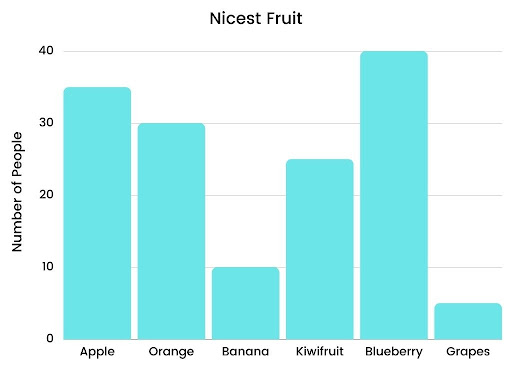
Vertical Bar Graph
Here is how a vertical bar graph looks like:

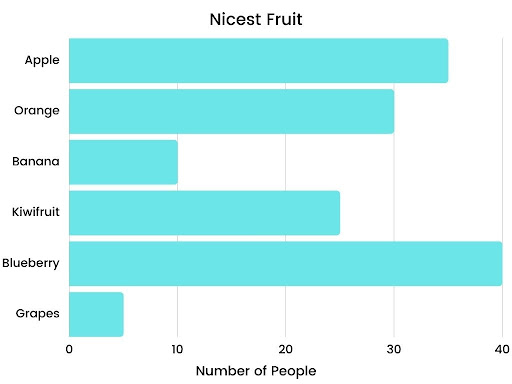
Horizontal Bar Graph
Here is how a horizontal bar graph looks like.

If you need more information on IELTS bar graph/chart, have a look at the video below!
Steps to Write a Band 9 IELTS Bar Chart Essay
If you wish to learn more about writing a high-scoring IELTS bar graph report for IELTS Writing Task 1 for the Academic test, here is a comprehensive process that will help you out.
- Evaluating the Question
The first and foremost step is to evaluate and analyze the question. In the question, you will get a brief description of the bar chart along with instructions. Your job here will be to discover the central idea.
- Assessing the Given Data
The next step is to assess the data that you have in the question. Find out whether it is dynamic or static. If it is dynamic data, it will show two or more time periods. If it is static data, it will show only one time period. For both these data types, you will have to use different languages to write the description.
- Discovering Primary Features
Majorly, bar graph questions are meant to test your mathematical as well as language skills. Hence, you must know how to derive the primary features from the given data and write about it.
Important Elements to Describe an IELTS Bar Chart
Here is the complete format that should be used when describing a bar chart or a bar graph in the writing module of the IELTS Academic exam.
- The Introduction
In the introduction paragraph, you would have to paraphrase the asked question. This can be done by using synonyms and paraphrased words and sentences. Also, ensure that this section is sounding natural.
- The Overview
Usually, an overview forms the second paragraph of the essay. In this one, you would have to write down the main features. Also, you must discover available comparisons and talk about general trends occurring in the given data.
- The First Body Paragraph
In the first body paragraph, you will have to give detailed information and explain the given data. Here, you must focus more on language instead of facts. Making relevant comparisons is always useful.
- The Second Body Paragraph
This second body paragraph will have your explanation of the remaining features. It will be the same as the first body paragraph, but with different information.
Ready to boost your writing skills? Enroll in IELTS Online Classes now!
Guidelines for Choosing Information from the Bar Graph
As you would already know, a bar graph question requires a report of 150 words to be written. To help you out with an easier way and score a top IELTS band score, you can follow (but not stick to) the below-mentioned guidelines.
| Format | Content |
|---|---|
| Introduction | One sentence |
| Main Features | Two sentences |
| Comparison | One sentence |
| Exception | One sentence |
| Describing Data | One sentence |
Samples of IELTS Bar Graph/Chart with Model Answers
Now it is time to practice some sample IELTS Bar/Chart following the guidelines given above. So, let us check out some IELTS bar/graph from IELTS Writing recent actual tests.
Sample 1
You should spend about 20 minutes on this task.
The chart below shows estimated world illiteracy rates by region and by gender for the year 2000. Write a report for a university lecturer describing the information below.
Write at least 150 words.

Check out the Band 7,8 & 9 answers of the above IELTS bar graph on 'Estimated World Illiteracy Rates by Region and by Gender'!
Sample 2
You should spend about 20 minutes on this task.
Write a report for a university lecturer describing the information below.
You should write at least 150 words.
Leisure time in a typical week in hour – by sex and employment status, 1998-99.
 Check out the answer of the above IELTS bar graph on 'Amount of Leisure Time Enjoyed by Men and Women of Different Employment Statuses'!
Tips to Write IELTS Bar Chart Essay
Jotted down below are some tips on how to improve your IELTS writing band score that will help you write a relevant, on-point IELTS bar chart essay
1. Is it difficult for you to match the word count?
Most of the time, people find it difficult to match the word count. Hence, they start using complicated words to unnecessarily extend the sentences. While using high-end IELTS vocabulary is a pro, writing sentences that are difficult to be understood is a con.
2. Be straightforward in your writing
When describing the bar graph, try not to complicate the description. Be straightforward and on-point.
3. Do you only practise with one type?
While practising, do you only try working on one type of chart or graph, or do you expand your horizons as well?
4. Practise as much as possible
While taking IELTS Writing practice tests, work on varying bar charts or graphs to enhance your ability to explain whatever comes in the examination.
5. Are you always in a hurry for submission?
One of the common mistakes that people commit is not reviewing their answers before submission. This could lead to you missing out on errors and issues that can impact your marking.
6. Review your writings before submitting
Once written, double-check for grammatical errors. Review important details for IELTS Grammar and superlatives to make sure you didn’t miss anything.
Here are 10 bar graph IELTS practice test examples:
- Example 1
- Example 2
- Example 3
- Example 4
- Example 5
- Example 6
- Example 7
- Example 8
- Example 9
- Example 10
Also check:
Frequently Asked Questions
What is a bar chart?
What is the structure of a bar graph?
What is the difference between introduction and overview? Can I skip the overview because I feel introduction is enough?
Can I have just one body paragraph where I give almost all the information?
What is the expected word count for describing a bar chart?
Practice IELTS Writing Task 1 based on report types

Start Preparing for IELTS: Get Your 10-Day Study Plan Today!
Explore other Writing Task 1 Articles
Recent Articles

Nehasri Ravishenbagam

Nehasri Ravishenbagam

Kasturika Samanta


Post your Comments