IELTS Task 1 Pie Chart: Strategies, Tricks, and Sample Answers
8 min read
Updated On
-
Copy link
Buckle up to read all about the IELTS Writing Task 1 Pie Chart Task, its vocabulary, and our band 9 sample answers here! Additionally, you also get to read our secret expert tricks for enhanced exam preparation with this article!

Table of Contents

Try AI Essay Checker for Instant Band Score
The IELTS pie chart is one of the most common types of visuals you may encounter in IELTS Writing Task 1 (Academic). Therefore, understanding how to describe the data in it accurately and using appropriate vocabulary is crucial for achieving a high score!
So in this blog, we’ll explore the essential IELTS Task 1 Pie Chart topics and vocabulary, provide sample IELTS pie chart questions and answers, and share helpful tips for tackling the questions effectively.
What is an IELTS Task 1 Pie Chart?
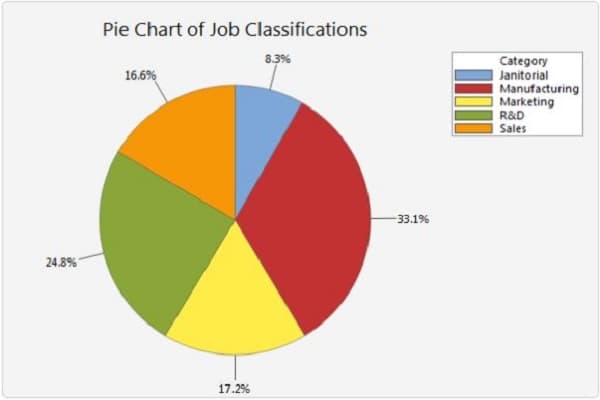
An IELTS Task 1 Pie Chart in IELTS Academic is a circular diagram divided into segments or “slices,” each representing a specific percentage or proportion of data. The size of each pie slice signifies the relative amount of data it represents. The slices form a complete circle when joined together.
These charts are often used to show the distribution of data, such as market shares, population demographics, or survey results.
The key challenge in describing pie charts is presenting the data clearly and concisely while using the right vocabulary to explain the proportions accurately for a high IELTS band score.
Let’s see an example of how to answer a basic pie chart below!
IELTS Task 1 Pie Chart Vocabulary
To describe a pie chart effectively, you need to use appropriate language to explain the various sections and their relationships. Below are some essential IELTS vocabulary you can use while describing IELTS pie chart topics:
| Category | Description | Examples |
|---|---|---|
| Percentages | 73% – nearly three-quarters, almost three-quarters, a large proportion | 51% – just over a half, slightly more than half |
| 49% – just under a half, nearly half | 25% – a quarter, one-fourth | |
| 10% – a small portion, a minor part | 100% – the whole, the entire amount | |
| Describing trends | Increase: grew, rose, climbed, went up | Decrease: fell, dropped, declined, went down |
| Stability: remained the same, stayed constant, levelled off | ||
| General terms for data | Majority: the largest share, the bulk, the predominant portion | Minority: a small fraction, the lesser portion, a small percentage |
| Distribution: spread, allocation, division | ||
| **Describing increases/ ** | Noun phrase + verb + adverb | Eg: The price of tomatoes fell sharply. |
| decreases | There + be + noun + in + noun phrase | Eg: There has been a sharp decrease in the price of leather goods. |
Note: Using these phrases in your descriptions will not only make your response more fluent, but will also help you express the data with precision.
How to Write an IELTS Task 1 Pie Chart?
When it comes to writing a pie chart description, you need to be wary of the following steps to score the highest possible band:
- Introduction
Before you start describing a pie chart, you would have to learn how to write an introduction in IELTS Writing! It should be wrapped up in two sentences. And, when you write an introduction, you must paraphrase the information given in the question. You would have to include two-pointers. The first would be what precisely the chart is showing, and the second is the time period.
- Writing the Overview
The second paragraph will be about covering the general, basic overview of the pie chart. You would have to choose a few primary features from the given chart and explain the same. First, you can take the smallest or biggest sections from the pie chart and jot down the explanation. Second, you can figure out the ones that did not change over the period of time. Ensure that you outline the significant changes in the chart.
- Mentioning Certain Details
In the last paragraph, you will have to write specific details. You can split them up into two or three paragraphs if you want. While doing so, you can choose to create one paragraph based on sectors that saw an increment, and the second paragraph could be about factors that either didn’t change or have decreased/increased.
Get your hands on the best IELTS Writing book for IELTS pie chart task 1 practice & more!
Top 10 Tips to Describe an IELTS Pie Chart
There are a few points and IELTS Writing tips that should be borne in mind while explaining the pie chart examples or even in the actual exam. They are as follows:
- The answer that you write should be 150 words. It might get rejected, otherwise. When you write the explanation, you must ensure that your answer is at least 155- 160 words, so that it doesn’t get rejected.
- You have to read the heading and the data labels of the chart carefully so that you get to know what the main details include and get an idea of how to write the explanation for the same.
- What you write must match the tense. This means that if the picture of the pie chart is in the present, then your explanation should also be in the present tense. If your chart represents the past, then your explanation should be in the past tense.
- While writing the introduction, you need to refer to the pie chart which you are going to explain.
- In the subsequent paragraphs, you can show a comparison between the two pie charts. It may be either differences or similarities.
- When describing an IELTS pie chart, you must make use of appropriate IELTS Grammar and pie chart vocabulary. For example, when relating information, use words like ‘related to’, ‘connected to’ and so on.
- Many times, comparing two charts is easier than writing an explanation for a single chart. So you need to focus on every detail in order to get strong points to write regarding the chart.
- Usually, the largest section in the pie chart will be important. You can skip the sections that will have “other” if you do not have much time, and if the word count is already more than 150 words.
- Do not mention anything which is not included in the pie chart data. There must be no deviations from the data that is given.
- You must read the question carefully so that you know in what tense it is set.
10 Latest IELTS Task 1 Pie Chart Topics with Sample Answers of 2025
Now that you have a basic idea about IELTS Task 1 pie charts, let us look at some IELTS pie chart questions and answers that have appeared in the IELTS Writing exam.
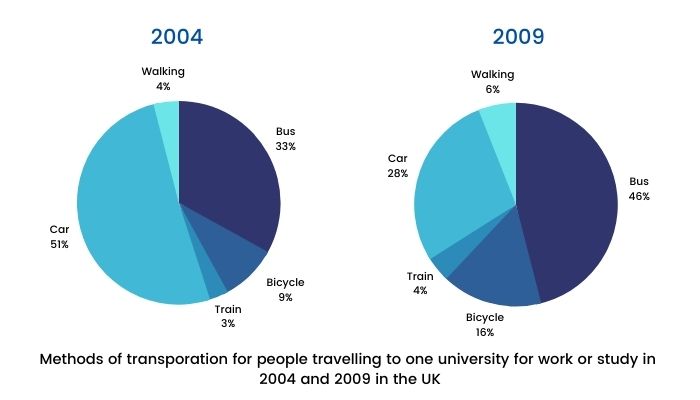
Example 1 - Methods of Transportation for People Traveling to a University
The chart shows the main methods of transportation for people travelling to a university for work or study in 2004 and 2009. Summarize the information by selecting and reporting the main features and make comparisons wherever relevant.
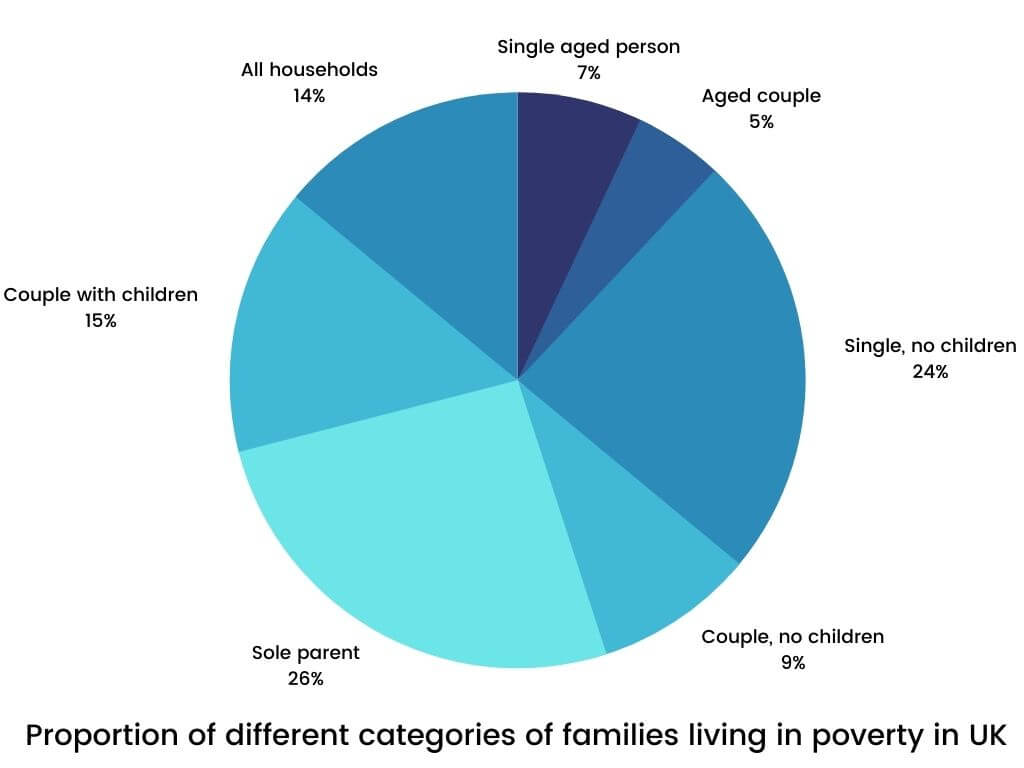
Example 2 - Proportion of different categories of families living in poverty in UK
The pie chart below shows the proportion of different categories of families living in poverty in UK in 2002. Summarise the information by selecting and reporting the main features, and make comparisons where relevant.
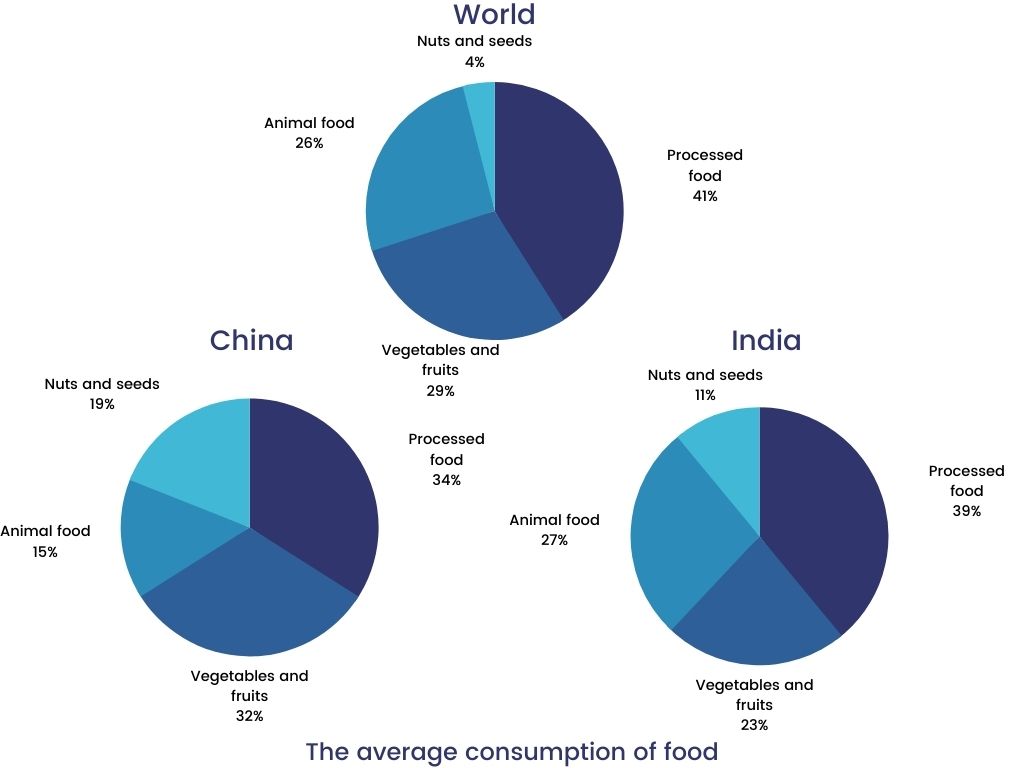
Example 3 - Average Consumption of food in the world
The pie charts show the average consumption of food in the world in 2008 compared to two countries; China and India. Write a report to a university lecturer describing the data.
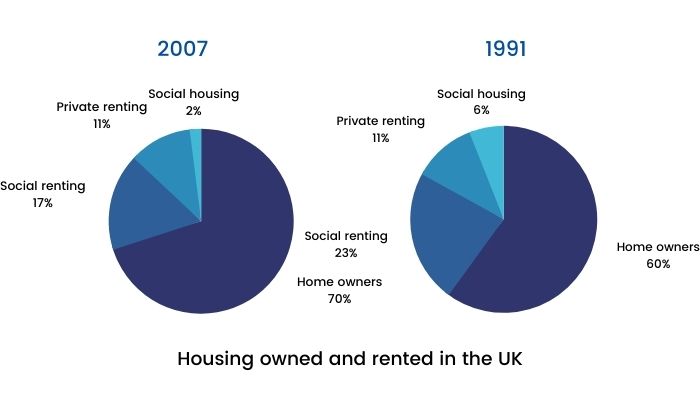
Example 4 - Percentage of housing owned and rented in the UK
The pie charts below show the percentage of housing owned and rented in the UK in 1991 and 2007. Summarize the information by describing the main features of the charts and making comparisons where appropriate. Write at least 150 words.
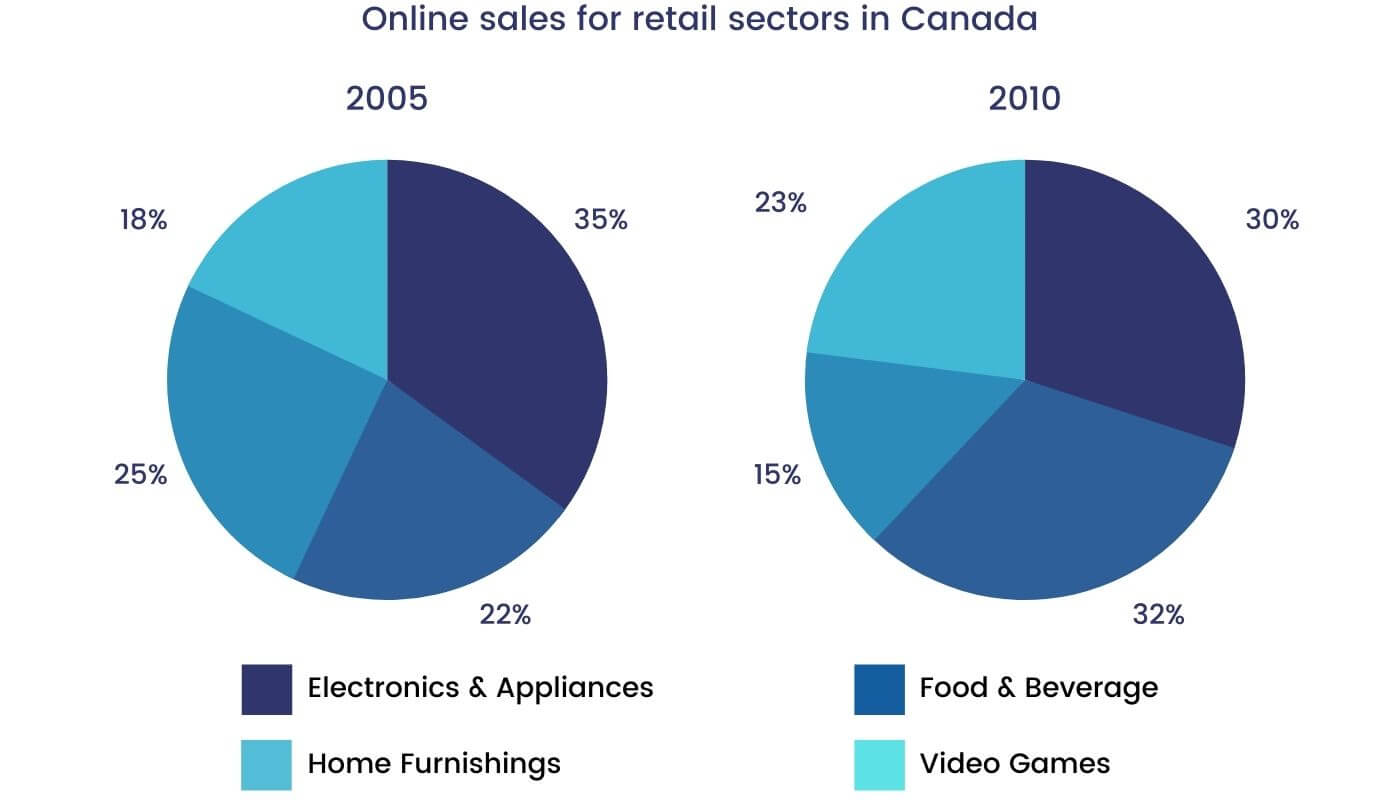
Example 5 - Online shopping sales for retail sectors in Canada
The two pie charts below show the online shopping sales for retail sectors in Canada in 2005 and 2010. Summarise the information by selecting and reporting the main features, and make comparisons where relevant.Write at least 150 words.
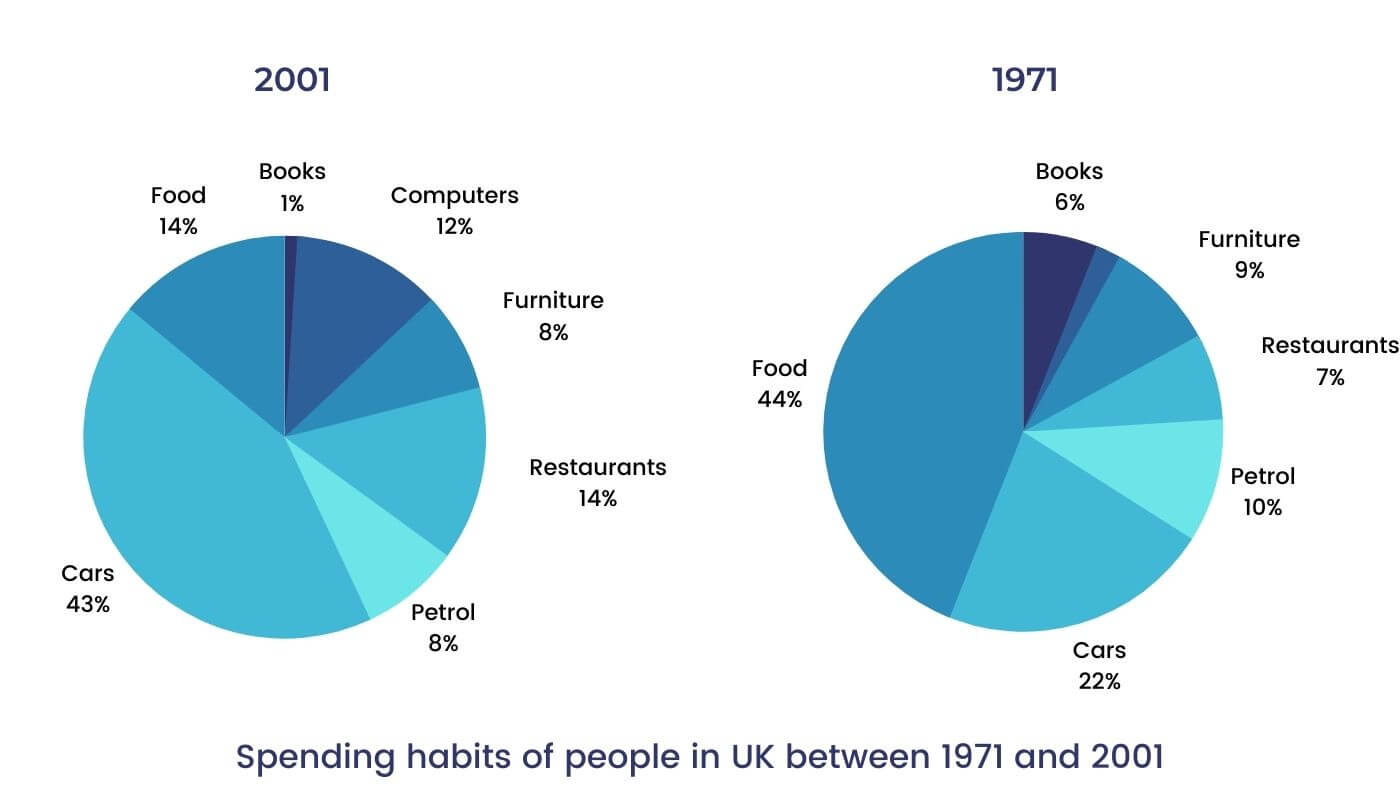
Example 6 - Changes in spending habits of people in UK
The graphs show changes in the spending habits of people in the UK between 1971 and 2001. Write a report to a university lecturer describing the data. Write at least 150 words.
Example 7 - Percentage of water used by different sectors
The charts below show the percentage of water used by different sectors in Sydney, Australia, in 1997 and 2007. Summarize the information by selecting and reporting the main features, and make comparisons where relevant.
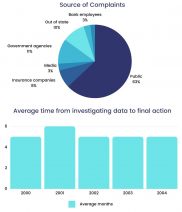
Example 8 - Source of complaints about the bank of America
The graphs indicate the source of complaints about Bank of America and the amount of time it takes to have the complaints resolved. Summarise the information by selecting and reporting the main features, and make comparisons where relevant. Write at least 150 words.
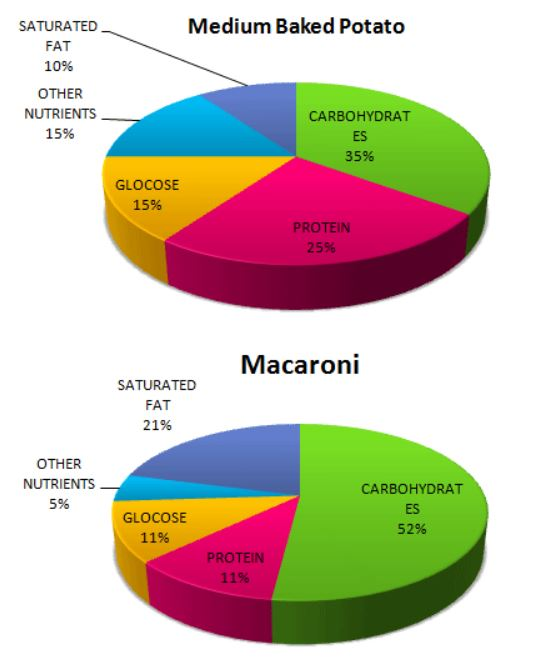
Example 9 - Nutritional consistency of two dinners
The pie graphs show the nutritional consistency of the two dinners. Write a report to a university lecturer describing the data. Write at least 150 words.
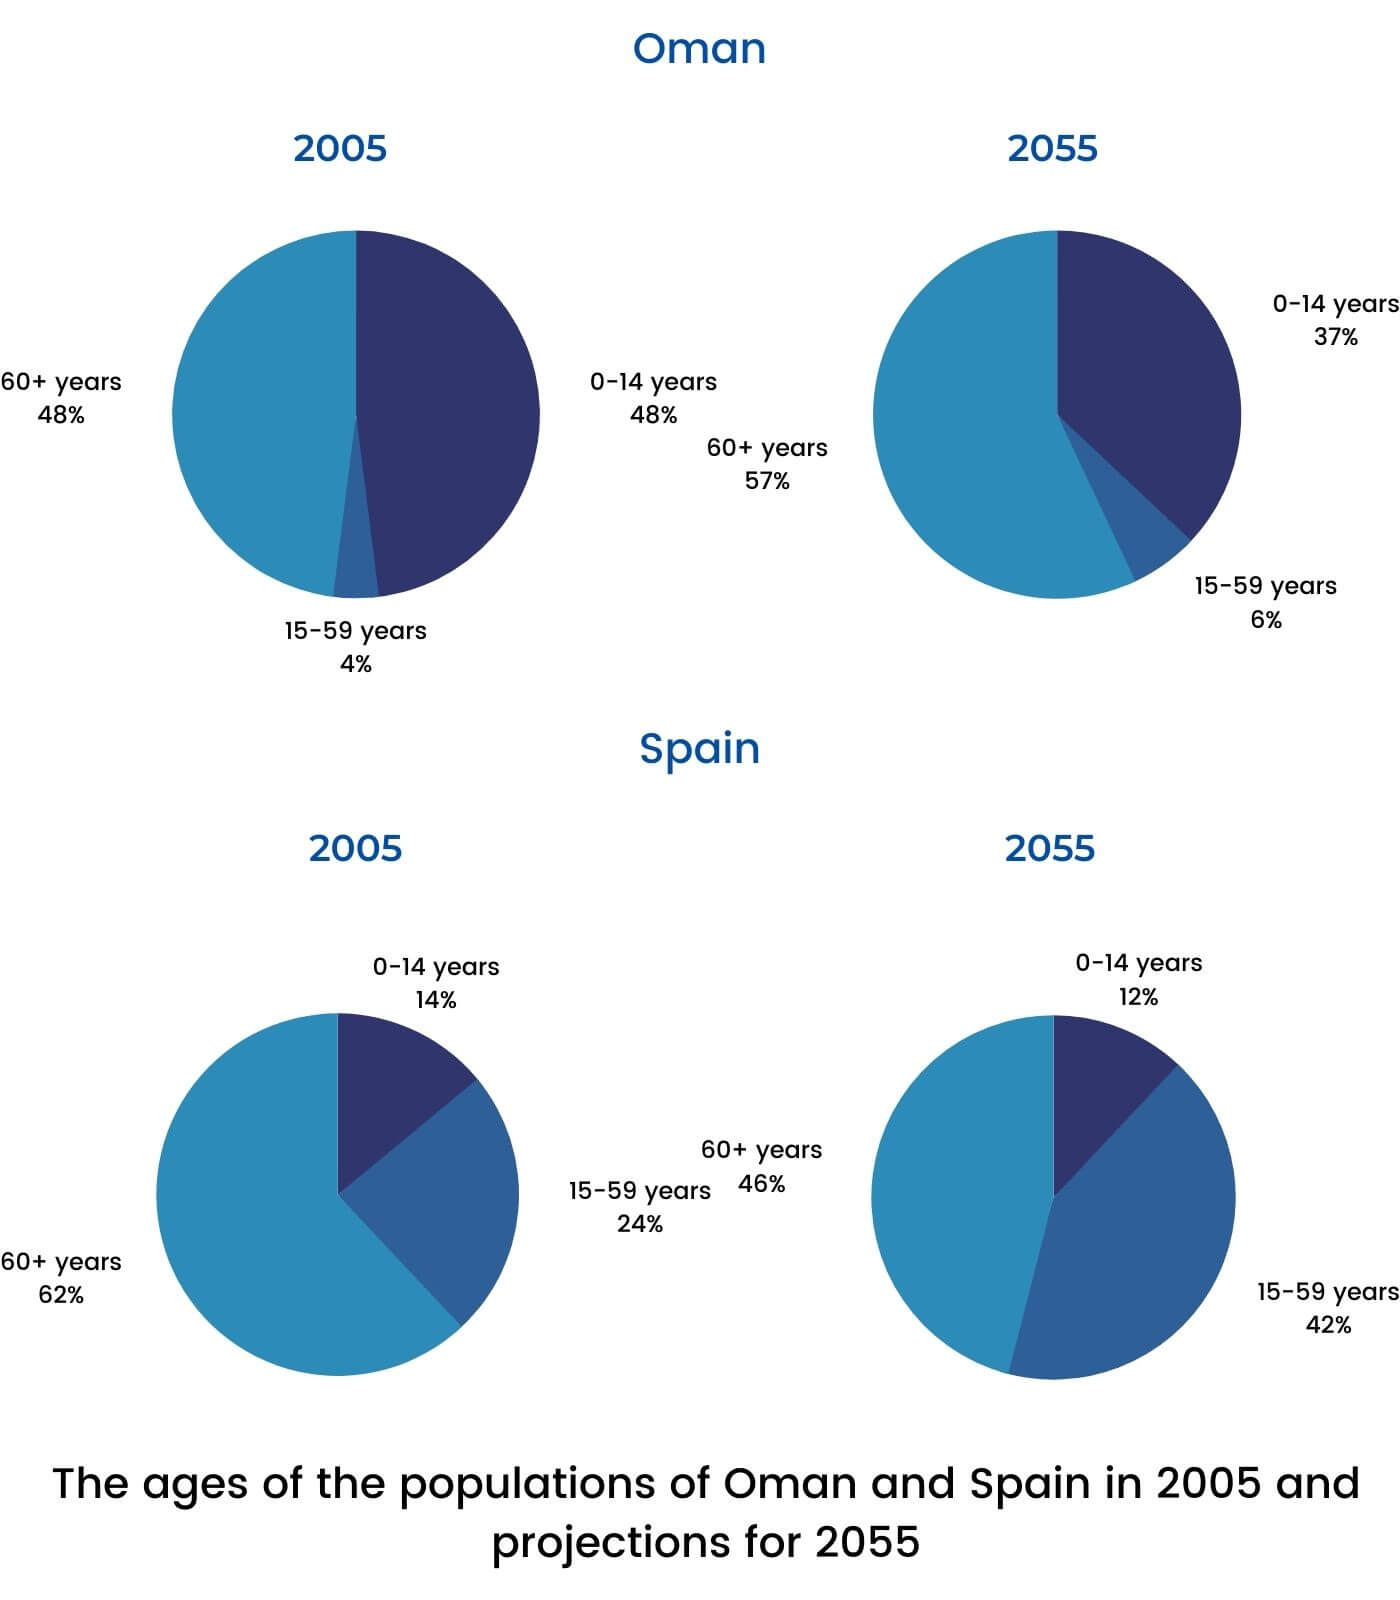
Example 10 - Ages of the populations of Oman and Spain
The pie charts below give information on the ages of the populations of Oman and Spain in 2005 and projections for 2055. Summarise the information by selecting and reporting the main features and make comparisons where relevant. Write at least 150 words.
To crack IELTS task 1 writing, get in touch with our expert trainers for a FREE session!
Get Better at Writing for IELTS with IELTSMaterial
Practising more IELTS writing practice tests as well as IELTS Writing topics on pie chart would be hugely beneficial for you!
If you are wondering how to succeed on the IELTS writing exam, join our free demo classes and talk to an IELTS expert. Also, we're holding interactive webinars where you can learn tricks to ace the writing component of the IELTS test. Let us know how it helped you prepare by leaving a comment below!
Some More IELTS Task 1 Pie Chart Topics for Practice
Here is the list of IELTS Writing Task 1 pie chart topics, which you can refer to while preparing for IELTS,
- Information on UAE government spending in 2000 – Pie chart
- The percentage of water used by different sectors – Pie chart
- Household expenditure of an average US family – Pie chart
- Use of public libraries in 1990 and 2000 in Britain – Pie chart
- How Energy is Used in an Average Australian Household- Pie Chart
Frequently Asked Questions
What is a pie-chart?
Is there a dedicated vocabulary for the pie-chart?
What is the structure for describing a pie-chart?
What significance does time period have in a pie-chart? Will it be mentioned in the pie chart?
If I observe any trend from the pie chart and if I know the reason for it, can I add the reason? Will it improve my score?
Practice IELTS Writing Task 1 based on report types

Start Preparing for IELTS: Get Your 10-Day Study Plan Today!

Explore other sample Pie Charts


Recent Articles

Nehasri Ravishenbagam


Nehasri Ravishenbagam

Kasturika Samanta


Post your Comments