IELTS Academic Writing Task 1 Topic : The percentage of water used by different sectors – Pie chart
2 min read
Updated On
-
Copy link
The IELTS Academic Writing Task 1 Topic : The percentage of water used by different sectors - Pie chart will provide an insight on the structure used in the IETLS exam.

Table of Contents

Try AI Essay Checker for Instant Band Score
Describe Image is one of the most complicated tasks in the IELTS Writing Academic Task 1 module. Without a sound plan, it can be difficult to perform well on the Describe Image exercise while appearing for the IELTS exam. The Pie Chart is the ideal format for practising the Describe Image problem because it has logically and simply organised all of the components. Elements of the Bar Graph include the title, the data, the legend, and the number of pie slices.
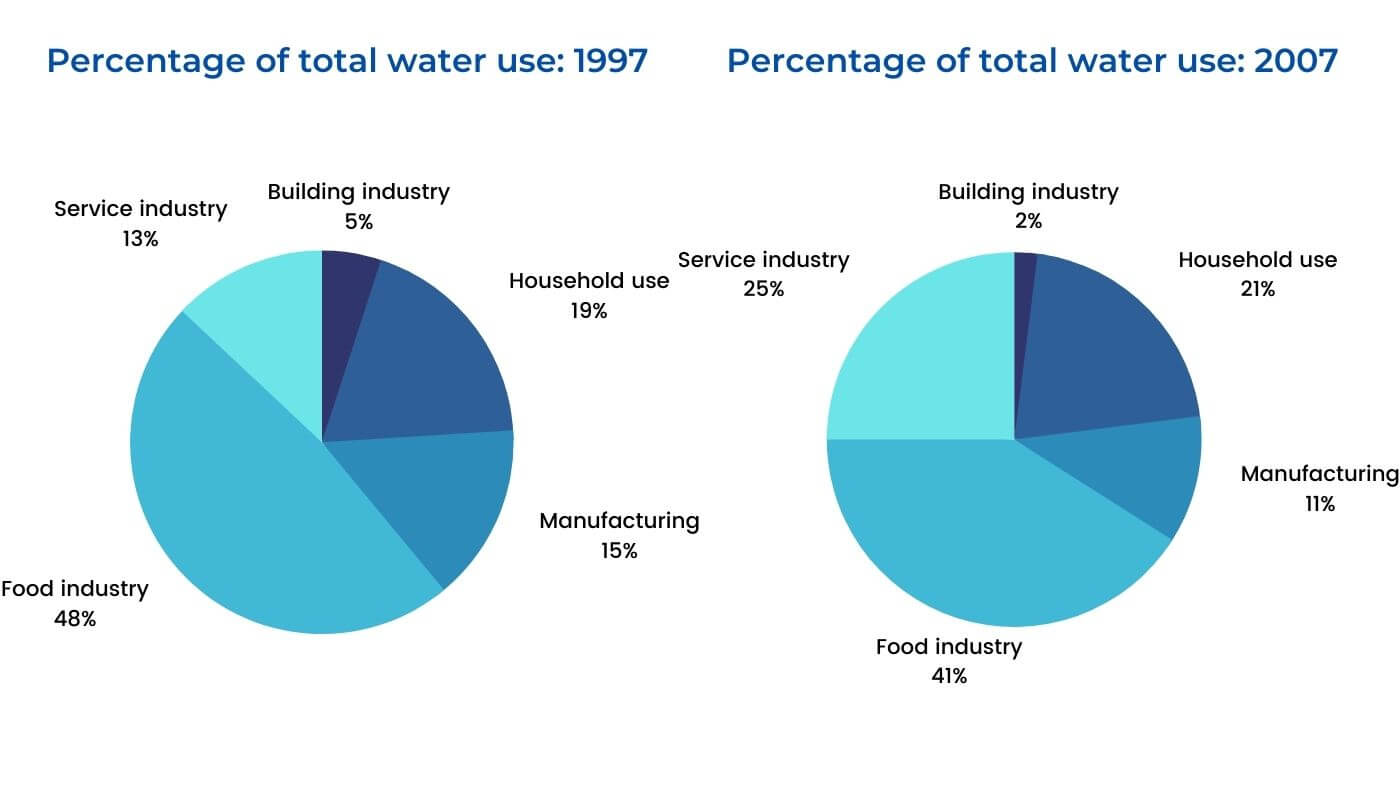
The charts below show the percentage of water used by different sectors in Sydney, Australia, in 1997 and 2007. Summarize the information by selecting and reporting the main features, and make comparisons where relevant.
Report Plan
• Paraphrase: show>compare; water used>usage of water; different>various
• Summary/overview paragraph: (1) highest percentage – food industry (2) service industry – a percentage of total water use almost doubled
• Paragraph 3: the decline of water use in 3 sectors – compare the food industry, manufacturing, and building, give figures
• Paragraph 4: contrast the increase in water use in the other sectors -households and service industry, give figures.
Sample Answer
The pie charts above illustrate the proportion of total water consumption by various sectors in Sydney, Australia, from 1997 to 2007.
In an overview, the food industry accounted for the highest percentage of water consumption. Besides, there was a dramatic increase in the water consumption ratio by the service industry from 1997 to 2007.
In 2007, the food industry witnessed a slight decrease of 7%, and the building industry, which earlier used 5% of the total water in 1997, dropped its water consumption ratio to 2% in 2007. Meanwhile, the water consumption by the manufacturing fell significantly in 2007, at 11% respectively.
On the contrary, the service industry and household sectors dramatically expanded their water usage in 2007. The service industry surged its water usage from 13% to 25%. At the same time, the figures for household activities moderately rose from 19% in 1997 to 21% in 2007.
Get evaluated for FREE!
Got a quick report in your mind for this question. Don’t hesitate to post the same in our comment section. We will evaluate the report/letter and email you the band score & our trainer’s comments. And, this service is entirely free.
See also:
Practice IELTS Writing Task 1 based on report types

Start Preparing for IELTS: Get Your 10-Day Study Plan Today!

Explore other sample Pie Charts


Recent Articles

Nehasri Ravishenbagam


Nehasri Ravishenbagam

Kasturika Samanta


Post your Comments