IELTS Writing Task 1 - Line Graph
6 min read
Updated On
-
Copy link
The article covers IELTS Writing Task 1 line graphs. It describes simple, multi-line, and compound line graphs, offering examples and sample answers. It emphasizes the importance of practice and provides tips for mastering line graph descriptions.

Table of Contents

IELTS Writing Prediction Questions for 2024
In IELTS Writing Task 1 of the IELTS Academic section, there will be a visual representation or a diagram on which you have to write a paragraph. One of these visual representations may be pie charts. The IELTS line graph shows how data changes over time. These line graphs will have 2 axes, one is X-axis and another is Y-axis. While the X-axis shows the time period and the Y-axis shows what is being measured.
The line graph highlights the trends when the data goes up and down. You should take only 20 minutes to complete this task and it should be a 150-word report. As a result, it is important for you to familiarize with the different types of IELTS line graphs as discussed in the next section of this article and practice them on a regular basis.
Line graph – An example:
Check out the IELTS Writing Task 1 Line Graph below to know how to identify them among the various types of other graphs given in IELTS Writing Task 1.
Types of Line Graphs:
There are three types of line graphs in IELTS exam. They are:
- Simple line graph
- Multiline graph (or) Polyline graph
- Compound line graph
Simple Line Graph:
Definition: These types of graphs have just a single line plotted on them.
Example:
You should spend about 20 minutes on this task.
Write a report for a university lecturer describing the information in the graph below.
Summarise the information by selecting and reporting the main features, and make comparisons where relevant.
Write at least 150 words.
Sample Answer
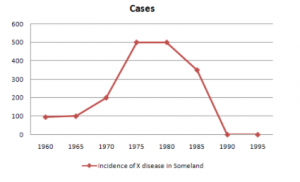
The given image depicts a line graph representing the trend in the occurrence of X disease in Someland from 1960 to 1995.
The line graph represents the presence of X disease in Someland in varying numbers at different time intervals until it is wiped out entirely from the place.
It is clear from the line graph that the number of people affected by X disease did not cross 100 between 1960 -1965. The number of affected individuals began rising after the year 1965 and reached 200 in 1970 and 500 in 1975 respectively. The occurrence of X disease remained stagnant between 1975-1980 at 500 affected individuals. After the year 1980, the number of cases took a downward trend, falling down to almost 350 in 1985 before being completely eradicated by the year 1990. The number of people affected by X disease in Someland has been zero from 1990 till 1995.
Multiline graph (or) Polyline graph Task 1:
Definition: They are commonly used for comparison. These types of graphs have more than one line. ( on the same axis).
Example:
The graph below shows the consumption of 3 spreads from 1981 to 2007.
Summarise the information by selecting and reporting the main features, and make comparisons where relevant.
Write at least 150 words.
Sample Answer
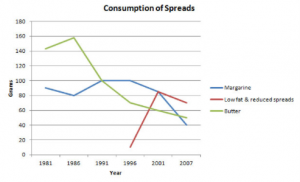
The graph portrays the consumption of three kinds of spread, namely, Margarine, Lowfat and reduced spreads and butter, over 26 years, from 1981 to 2007.
It is evident that butter and margarine were the primary spreads used until the introduction of low-fat and reduced spreads.
The staple spread from the early 1980s till the early 1990s was butter. The consumption of margarine followed a fluctuating trend over the years, from 1981 to 1986. The consumption decreased but then rose till 1991 and remained stagnant till 1996 after which it started declining. The use of low-fat and reduced spread began from 1996 and rose sharply from the first year till 2001 after which its preference decreased.
With regards to quantity, butter peaked at about 160 grams after which it followed a downward trend. The quantity of Margarine was within 80-100 grams for 20 years till 2001 after which it fell to 40 grams in 2007. The number of low-fat spreads crossed 80 grams in 2001 after which its consumption quantity fell.
Compound line graph:
Definition: It is an advanced version of the multi-line graph. The area between two lines is shaded indicating the size of that part.
Example:
The graph below shows the frequency of 3 kinds of vehicles at different times of day on a road.
Summarise the information by selecting and reporting the main features, and make comparisons where relevant.
Write at least 150 words.
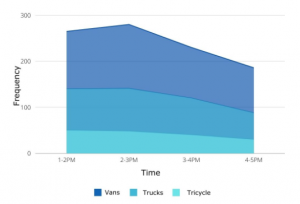
The given graph shows the frequency of three different kinds of vehicles, which are, vans, trucks and tricycles on a road at different times of the day.
It is clear from the graph that at any point in time, the number of vans on the road are the highest among the three vehicles, followed by trucks and then tricycles. The peak hour of vans and trucks falls between 2-3 pm.
The number of vans on the road increases from 1-2 pm till 2-3 pm and then gradually decreases. The number of trucks on the road remains the same till 2-3 pm after which their number also starts declining. The number of tricycles is highest at 1-2 pm and then it follows a downward trend all throughout the day.
The road in question is dominated by vans for most of the day and trucks are also quite frequent during the afternoon. The number of tricycles are less as compared to the other two types of vehicles.
Tips for IELTS Writing Task 1 Line Graph 2024
- In the introduction part, you can paraphrase the question asked or the topic of the essay.
- When you explain the overall trend, identify the main feature and explain it.
- Ensure that each paragraph has examples that are percentages or numbers to support the sentence written as an explanation.
- You can look into the various lessons available on the line graph in order to answer the complex questions.
- The last tip is to practice as much as possible so that you get a good hold on what to write in the examination when questions become complex.
- You also need to use appropriate IELTS Writing Task 1 line graph vocabulary like suitable verbs, nouns, adverbs, adjectives, prepositions related to time.
Writing the exam without practicing is a waste because you will not be able to understand anything in the exam. It may become complex and test-takers may skip the question which in turn will reduce your IELTS band score.
Here are the 10 examples for the IELTS Writing Line Graph Task 1 2024:
- Example 1
- Example 2
- Example 3
- Example 4
- Example 5
- Example 6
- Example 7
- Example 8
- Example 9
- Example 10
Also check:
Frequently Asked Questions
What is a line graph?
Is there a dedicated vocabulary for line graph?
What is trend in a graph?
What is the structure used to describe a line graph?
Is conclusion required for writing task 1 – Line graph?
Practice IELTS Writing Task 1 based on report types

Effective IELTS Essay Connectors for Writing Task 2 & Task 1

Recent Articles

Nehasri Ravishenbagam


Nehasri Ravishenbagam

Kasturika Samanta


Post your Comments
1 Comment