IELTS Academic Writing Task 1 Topic 38: Paris Metro station passengers – Line Graph

Table of Contents

Try AI Essay Checker for Instant Band Score
IELTS Line Graph questions based on themes like Paris Metro station passengers are one of the significant components of the Academic Writing section. In this question, you are required to prepare a report of at least 150 words. So, this article has been prepared to help you with IELTS line graphs.
The line graph shows Paris Metro station passengers. Summarise the information by selecting and report in the main features, and make comparisons where relevant.
Write at least 150 words.
Report Plan
Paraphrase: show>designates; Paris Metro station passengers>number of people using a metro station in Paris
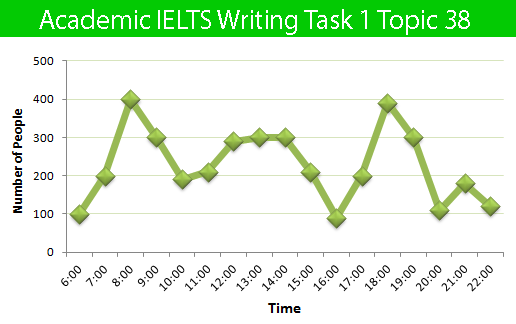
Overview: The line graph designates the number of people using a metro station in Paris over a given day of the year.
Paragraph 2: (1) Compare the statistics throughout the day. Give figures.
Paragraph 3: (1) Compare the statistics throughout the day. Give figures.
Sample Answer
The line graph designates the number of people using a metro station in Paris over a given day of the year.
The number of passengers rises sharply in the morning, reaching a peak of 400 at 8 am. After the morning peak, there is a steady drop to 300 at 9 am, and less than 200 at 10 am. Between 10-11 am, there is a small increase. The number plateaus just below 300 between 12 noon and 2 pm. There is a decline in the number of citizens using the station at 4 pm, basically standing at a number of 80 passengers. The evening brings a huge increase from 200 at 5 pm to almost 400 at 6 pm. The number of passengers tapers off slightly after 6 pm but falls quickly to 120 by 8 pm. After a small rise at 9 pm, the number tails off to 120 at 10 pm.
All in all, the time series shows that the greatest number of passengers gather in the station early in the morning and also early in the evening.
Get evaluated for FREE!
Got a quick report in your mind for this question. Don’t hesitate to post the same in our comment section. We will evaluate the report/letter and email you the band score & our trainer’s comments. And, this service is entirely free.
Also check:
Practice IELTS Writing Task 1 based on report types

Start Preparing for IELTS: Get Your 10-Day Study Plan Today!

Recent Articles

Nehasri Ravishenbagam


Nehasri Ravishenbagam

Kasturika Samanta


Post your Comments
8 Comments