IELTS Academic Writing Task 1 Topic: Price changes for fresh fruits and vegetables – Line Graph
2 min read
Updated On
-
Copy link
Table of Contents

Try AI Essay Checker for Instant Band Score
Summarise the information by selecting and reporting the main features, and make comparisons where relevant.
Write at least 150 words.
Report Plan
Paraphrase: shows>provides information; price changes for>changes in the price of
Overview: The line graph provides information about changes in price of three different food product groups in the USA from 1979 to 2009.
Paragraph 2: (1) Talk about the overall picture. Give a gist of the graph.
Paragraph 3: (1) Talk about price changes. Give figures.
Paragraph 4: (1) Talk about price changes. Give figures.
Sample Answer
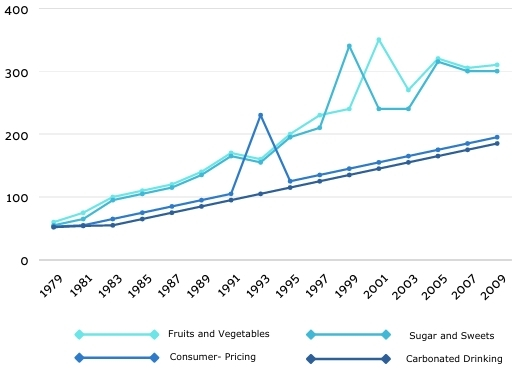
The line graph provides information about changes in the price of three different food product groups in the USA from 1979 to 2009 and the overall trend in the consumer price index over these 30 years.
Overall, it is clear that prices increased for the three food product groups, despite fluctuations. At a glance, an increase in the prices for fresh fruits and vegetables was significantly higher than the rise in the general consumer price index.
All the lines on the graph have the same starting figure in 1979. Over the period, the consumer price index rose steadily from around 60 in 1979 to over 200 in 2009. Prices for sugar and sweets and carbonated drinks showed similar trends. Although their prices also rose, they were consistently below the consumer price index average after 1987. After many minor fluctuations, the number for sugar and sweets was 200 on the graph in 2009, higher than the final figure for carbonated drinks at 150.
Prices rose sharply for fresh fruits and vegetables, particularly after 1989. From the same figure of about 60 at the start of the period, the prices finished at roughly 330 on the index in 2009.
Get evaluated for FREE!
Got a quick report in your mind for this question. Don’t hesitate to post the same in our comment section. We will evaluate the report/letter and email you the band score & our trainer’s comments. And, this service is entirely free.
Also check:
Practice IELTS Writing Task 1 based on report types

Start Preparing for IELTS: Get Your 10-Day Study Plan Today!

Explore other sample Line Graphs


Recent Articles

Nehasri Ravishenbagam


Nehasri Ravishenbagam

Kasturika Samanta


Post your Comments
5 Comments