IELTS Academic Writing Task 1 Topic: Different sources of air pollutants – Line Graph
2 min read
Updated On
-
Copy link
The IELTS Academic Writing Task 1 Topic: Different sources of air pollutants - Line Graph provides an insight onto the structure needed to attempt the IELTS Writing Academic Task 1. Prepare with the question to ace the IELTS exam!
Table of Contents

Effective IELTS Essay Connectors for Writing Task 2 & Task 1
Report Plan
Paraphrase: shows>illustrates; different sources >3 sources
Overview: The given graph represents the patterns of employment in America between the time period of 1930 and 2010.
Paragraph 2: (1) Talk about the employment patterns in different sectors Give figures.
Paragraph 3: (1) Talk about the employment patterns in different sectors Give figures.
Paragraph 4: (1) Talk about the employment patterns in different sectors Give figures.
Sample Answer
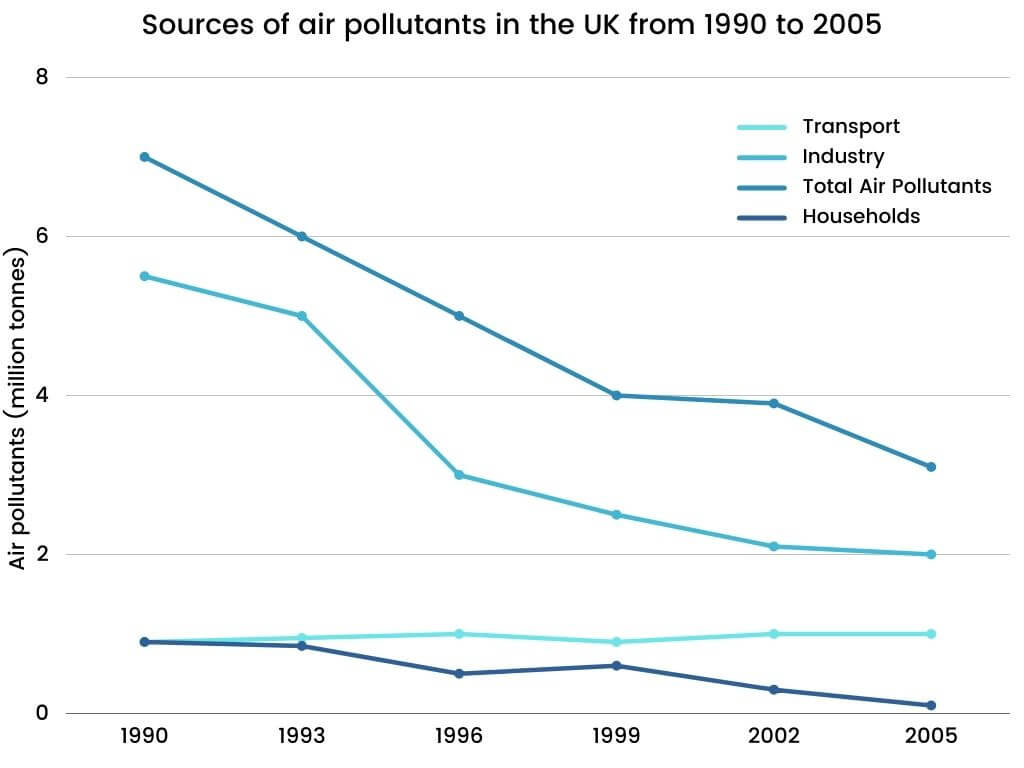
The line graph illustrates data on 3 sources of air pollutants in the UK during the period 1990 to 2005.
Overall, it is clear that the total amount of pollutants in the air has decreased over the years. The decline in air pollutants from industrial sources is predominantly substantial.
To commence with, the total volume of air pollutants in the UK, in 1990, was nearly 7 million tonnes. This figure had a sharp decline to 4 million tonnes in 1999. After that, it continued experiencing a dip to just over 3 million tonnes towards the end of the said period.
Moreover, around 5.5 million tonnes of air pollution was taken by the industry in 1990. And then, throughout the period, there was a decrease, and the figure reached up to 2 million tonnes by 2005, with a specific sharp decline between 1993 and 1996. On the contrary, the air pollutant’s amount was lower from the sources of transport and household. From transport, air pollution stayed almost constant at approximately 1 million tonnes from 1990 to 2005. On the other hand, pollutants from households decreased from nearly 1 million tonnes to almost 0.1 million tonnes in 2005.
Get evaluated for FREE!
Got a quick report in your mind for this question. Don’t hesitate to post the same in our comment section. We will evaluate the report/letter and email you the band score & our trainer’s comments. And, this service is entirely free.
Also check :
Practice IELTS Writing Task 1 based on report types

Band 9 IELTS Vocabulary for Academic Writing Task 1 + PDF

Recent Articles

Nehasri Ravishenbagam


Nehasri Ravishenbagam

Kasturika Samanta


Post your Comments
7 Comments