IELTS Academic Writing Task 1 Topic 24 : Hours worked and stress levels amongst professionals in eight groups – Graph
Table of Contents

Try AI Essay Checker for Instant Band Score
You should spend about 20 minutes on this task.
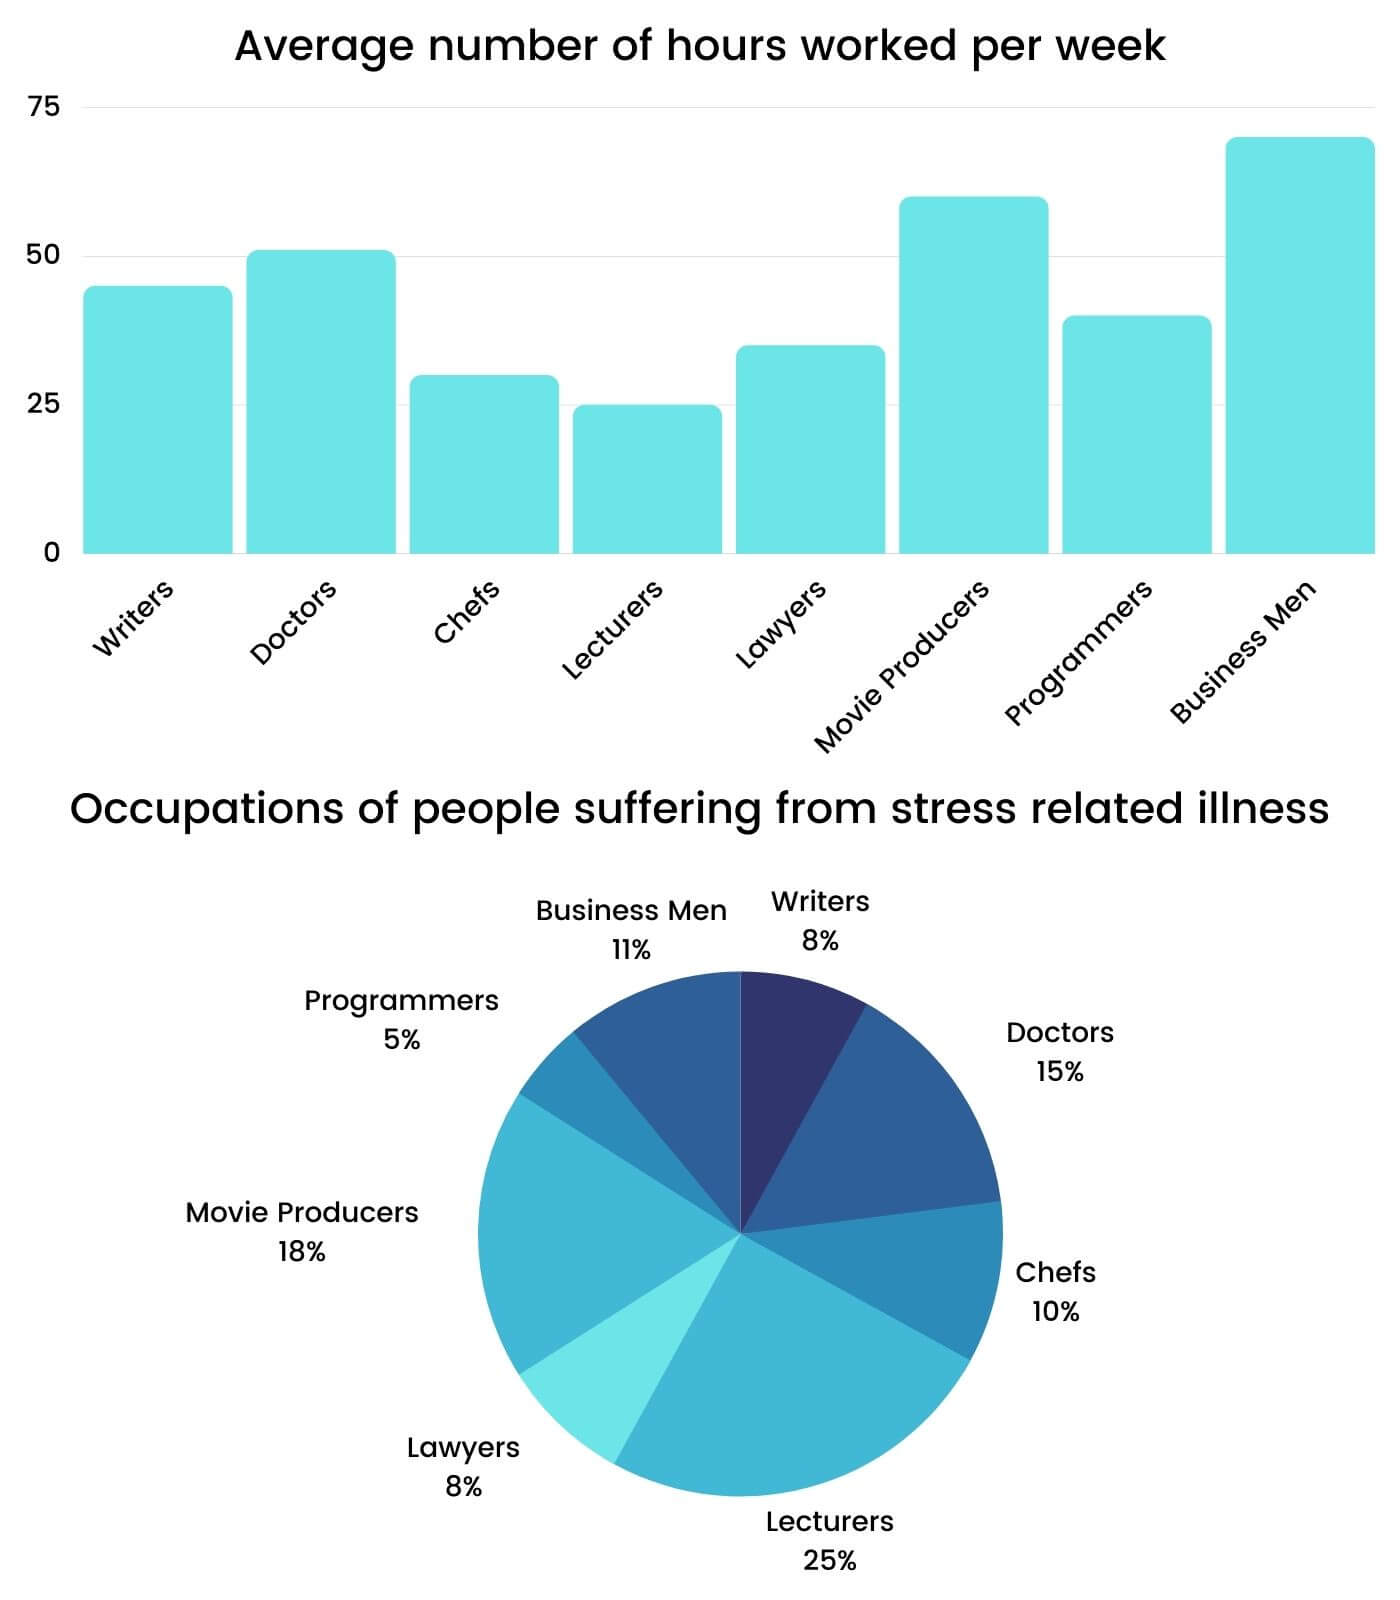
The graphs show figures relating to hours worked and stress levels amongst professionals in eight groups.
Describe the information shown to a university or college lecturer.
Write at least 150 words
Report Plan
Paraphrase: show>demarcates; hours worked and stress levels amongst professionals>working hours of eight categories of professionals and the percentages of those dealing with stress-related issues
Overview: The given illustration shows the average working hours of eight categories of professionals and the percentages of those dealing with stress-related issues.
Paragraph 2: (1) compare the number of hours professionals work and their stress-related issues. Give figures.
Sample Answer
The given illustration demarcates the average working hours of eight categories of professionals and the percentages of those dealing with stress-related issues. The overview states that business owners have lesser anxiety issues, despite working for extended hours. On the other hands, teachers who work for a specific number of hours a day have the highest anxiety issues.
As per the statistics, businessmen work nearly 70 hours a week, which is higher than other professionals. Even though the professional engagement is longer, their work-stress percentage is lower, precisely 11%. Movie producers and doctors both have working hours exceeding 10 hours a day, and their illness percentage from work pressure accounts for 18% and 15%, respectively. Writers and programmers have significantly lesser stress issues despite more office duration than chefs, who work nearly 30 hours each week, constituting 10% of patients with stress-related problems. It should be noticed that one in four lecturers are dealing with stress-related sickness, despite their working hours being the lowest in a week, which is merely 25 hours. This states that stress illness from professional engagement is not directly proportional to the working hours.
Get evaluated for FREE!
Got a quick report in your mind for this question. Don’t hesitate to post the same in our comment section. We will evaluate the report/letter and email you the band score & our trainer’s comments. And, this service is entirely free.
Also check:
Practice IELTS Writing Task 1 based on report types

Start Preparing for IELTS: Get Your 10-Day Study Plan Today!

Explore other sample Bar Charts

Recent Articles

Nehasri Ravishenbagam


Nehasri Ravishenbagam

Kasturika Samanta


Post your Comments
1 Comment