IELTS Academic Writing Task 1 Topic 06: Global population percentages and distribution of wealth – Bar chart
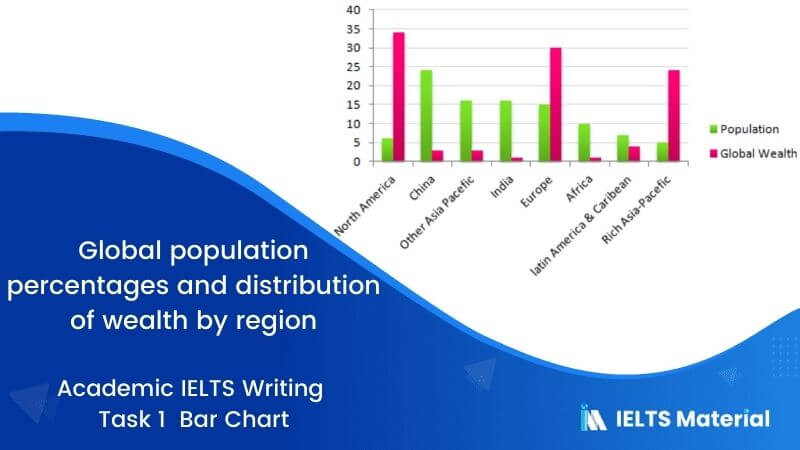
Table of Contents

Try AI Essay Checker for Instant Band Score
You should spend about 20 minutes on this task.
The chart below gives information about global population percentages and distribution of wealth by region.
Summarise the information by selecting and reporting the main features, and make comparisons where relevant.
Write at least 150 words.
Report Plan
Paraphrase: gives information>compares; information about global population percentages and distribution of wealth by region>the population shares in a gamut of regions worldwide with the wealth distribution in these same regions Overview: Compare the population shares in different regions worldwide with the wealth distribution. Paragraph 2: (1) compare different countries and their wealth distribution. Give figures. Paragraph 3: (1) compare the remaining countries and their wealth distribution. Give figures. Paragraph 4: (1) give the overall summary and talk about the trend.
Sample Answer
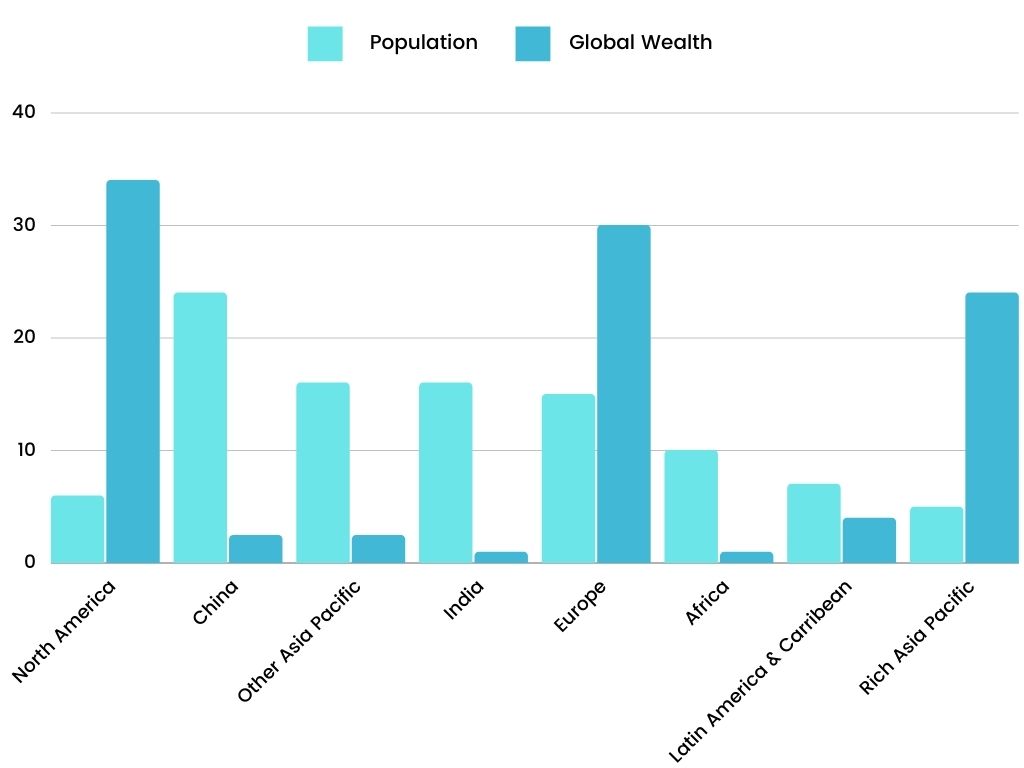
The above-given chart compares the population shares in a gamut of regions worldwide with the wealth distribution in these same regions. It is evident that wealth is heavily concentrated in Europe, North America, and high-income Asia-Pacific nations, which accounts for approximately 90% of global wealth.
Despite having around 6% of the world’s population, North America still boasts nearly 34% of the global wealth. An akin situation can be noticed in Europe, contributing 30% to the global wealth, even though its population is merely 15%. In terms of high-income Asia-Pacific nations, which have 5% of the worldwide population, the world gets 24% of its wealth.
In contrast, the all-inclusive share of wealth owned by people residing in India, China, Africa and other low-income nations in Asia is significantly less than their share of the population. Sometimes, it also goes down by a factor of more than ten. The situation is quite striking in India, where the population is 16% of the world, but the wealth is meagerly 1%. On the other hand, in China, which has the highest global population (24%), the wealth contribution is only 3%.
Overall, the statistics of the world population seem to be inverse in proportion to wealth distribution. If the former is higher, the latter is possibly lower.
Get evaluated for FREE!
Got a quick report in your mind for this question. Don’t hesitate to post the same in our comment section. We will evaluate the report/letter and email you the band score & our trainer’s comments. And, this service is entirely free.
Also check:
Practice IELTS Writing Task 1 based on report types

Start Preparing for IELTS: Get Your 10-Day Study Plan Today!

Explore other sample Bar Charts


Recent Articles

Nehasri Ravishenbagam


Nehasri Ravishenbagam

Kasturika Samanta


Post your Comments
4 Comments