IELTS Academic Writing Task 1 Topic 04: Marriage and Divorce Statistics for eight countries – Bar chart
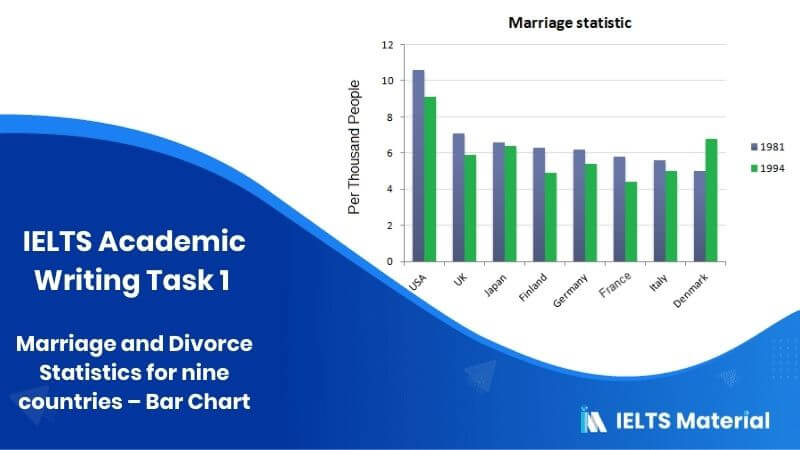
Updated On


Limited-Time Offer : Access a FREE 10-Day IELTS Study Plan!
Contents
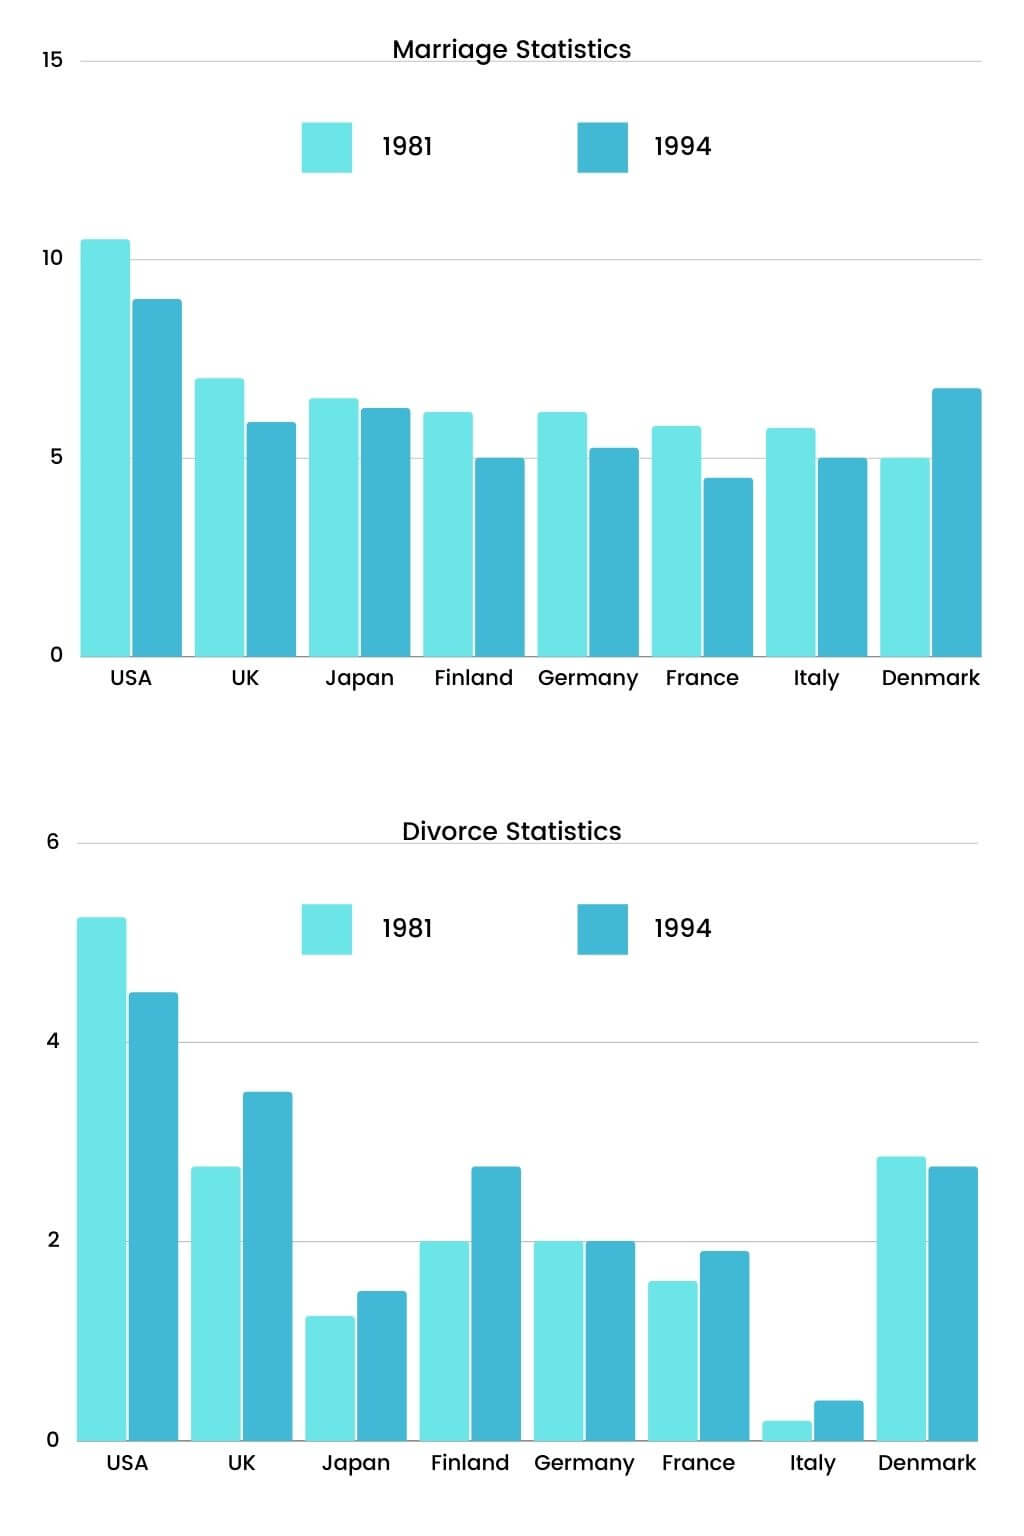
The bar charts below show the Marriage and Divorce Statistics for eight countries in 1981 and 1994.
Write a short report for a university lecturer describing the information shown below.
Write at least 150 words.

Report Plan
Sample Answer
The bar graphs are representing the total number of marriages and divorces in eight varying countries throughout the period of 1981 and 1994. The surveyed nations include the USA, Japan, UK, Germany, Finland, Denmark, Italy and France. As it can be clearly seen in the chart, the rate of marriages in all of the nations, excluding Denmark, had a sharp decline over the period of survey. However, there seems to be a rise in total divorce cases.
The bar chart represents that the marriage rate in 1981 in the US was the highest in comparison to other nations, which was exceeding 10 per thousand. On the contrary, in 1994, this number declined to 9 per thousand people. In other European nations, including Italy, Denmark, Finland, France and the United Kingdom, the marriage rate was approximately 6 for every thousand people. In 1981, standing at 5 per thousand, Denmark recorded the lowest number of marriages. The graph also shows that post 15 years, the marriage rate fell further in most of the countries. However, in Denmark, the number saw an increase, which was nearly 2 per thousand.
In 1981, Germany and Finland recorded almost the same rate, a little more than 6 per thousand. Still, a significant drop was recorded in both these nations. In Finland, the marriage rate declined to a little more than 4 per thousand in 1994 and it was closer to 6 in Germany during the same time.
Also, from the divorce statistics, it is clear that the maximum rate of divorce was seen in the USA, which was a bit over 5 per thousand in 1981. The divorce rate of 1994 was compared to the marriage rate of 1981 in all of the countries, including Denmark and the USA. The lowest number of divorce rate was registered in Italy among others. Germany showed stability for 2 years. And then, the divorce rate per thousand increased a bit from less than 3 per thousand in 1981 to more than 3 in 1994.
Get evaluated for FREE!
Got a quick report in your mind for this question. Don’t hesitate to post the same in our comment section. We will evaluate the report/letter and email you the band score & our trainer’s comments. And, this service is entirely free.
Also check:
- IELTS Writing Task 1
- IELTS Pie chart
- IELTS Bar chart
- IELTS Table chart
- IELTS Writing task 1 line graph
- IELTS Writing task 1 Map
- IELTS Writing task 1 tips
- Tips to Improve IELTS Writing Skills
- IELTS Writing recent actual test
- IELTS Writing Answer sheet
- IELTS map vocabulary
- IELTS Writing Task 1 Connectors
Practice IELTS Writing Task 1 based on report types


Start Preparing for IELTS: Get Your 10-Day Study Plan Today!
Explore other sample Bar Charts


Recent Articles


Courtney Miller
Post your Comments
10 Comments
Chusnul-khotimah
Posted on Dec 5, 2023
The charts give us the information about the data of the marriage and divorce for eight countries in 1981 and 1994.
Overall, the marriage statistics showed slightly different numbers while in the divorce statistics had variative numbers in eight countries. The highest data of the marriage and divorce was in the USA. Italy had the least rate in divorce.
The USA was the highest country in marriage in 1981 and 1994 (around 11 per thousand and 9 per thousand respectively). While most countries indicated modestly decrease in 1981 and 1994, Denmark showed slightly increase from exactly 5 per thousand in 1981 to around 7 per thousand in 1994. The number of people who married in eight nations remained stable around 7 per thousand in 1981 and around 5 per thousand in 1994.
The highest divorce rate was in the USA, at nearly 6 per thousand people in 1981 and around 4.5 per thousand in 1994. Italy had the least numbers of divorce, it was approximately 0.2 per thousand in 1981 and around 0.5 per thousand in 1994. Germany showed the constant number of divorce at exactly 2 per thousand in both years.
Reply
IELTS Expert
Posted on Dec 6, 2023
Overall Band: 4
Few key features have been selected only.Information and ideas are evident but not arranged coherently, and there is no clear progression within the response. User needs to work on cohesion and coherence.
To Learn more Tips on IELTS Writing, Avail a FREE 1:1 Class with our Expert Trainer here.
Ty
Posted on Nov 13, 2023
Is it ok to talk about marriages in one paragraph and divorces in another?
Reply
IELTS Expert
Posted on Nov 15, 2023
Hello
It all depends upon the cohesion and coherence in your writing. You can write in different paragraphs or compare and contrast in a single paragraph also.
For the time tested techniques you can avail a Free Writing Demo class here.
Grissom-fan
Posted on Oct 17, 2023
why is the different between the 1st sentence of paraghy 1 and 2? representing and represented?
Reply
Dilek
Posted on Sep 10, 2023
The chart signifies the rate of marriage and divorce trends in 8 countries in the years of 1981 nd 1984. While marriage rates are high in 1981, it can be foreseen that it is tend to decline in 1984 nearly all the countries except Denmark. Contrary to the other countries, the marriage numbers in Denmar has shown an increse almost 3 thousand people. The most significant drop in marriga enumber can be noticed in the USA and France by 3 thousand people throughout the given years.
It can be forseen that the changes in the number of people are higher in divorce graph.In the USA and Denmark, the divorce rate has gotten low, as It keeps its stability in Germany. In the other countries, although numbers varies, when compared to marriage and divorce rates, increasing in divorce rates can be seen. Italy is by far the least divorce numbers of all the countries.
Reply
kavita Timbadia
Posted on Sep 13, 2023
Band 4.5
The response is an attempt to address the task.
(Academic) Few key features have been selected.
Key features/bullet points which are presented may be irrelevant, repetitive,
inaccurate or inappropriate.
Information and ideas are evident but not
arranged coherently, and there is no clear
progression within the response.
Relationships between ideas can be unclear
and/or inadequately marked. There is some
use of basic cohesive devices, which may be
inaccurate or repetitive.
There is inaccurate use or a lack of
substitution or referencing.
The resource is limited and inadequate for
or unrelated to the task. Vocabulary is basic and
may be used repetitively.
There may be inappropriate use of lexical chunks
(e.g. memorised phrases, formulaic language
and/or language from the input material).
Inappropriate word choice and/or errors in word
formation and/or in spelling may impede
meaning.
A very limited range of structures is
used.
Subordinate clauses are rare and
simple sentences predominate.
Some structures are produced accurately
but grammatical errors are frequent and
may impede meaning.
Punctuation is often faulty or inadequate.
For further detail evaluation . You can avail a Free trial class
Find the link below:
https://ieltsmaterial.com/signup-1/
dirmanas
Posted on Jun 5, 2022
The bar charts provide information about marriage and divorce rates in eight countries between 1981 and 1994.
Overall, the statistics of marriages declined in all countries in the given period of time, except Denmark. Interestingly, the USA had the highest percentages both in marriage statistics and divorce statistics in 1981 and 1994. Italy, on the other hand, had the lowest point of divorce in comparison with other countries.
From 1981 to 1994, while the number of married people declined in the UK, Japan, Finland, France, and Italy, the proportion of divorced couples began to rise in those countries. The USA was the only country where the divorce statistics showed a downward trend (approximately from 5 to 4.5). Surprisingly, the divorce rates remained at around 2 points in Germany throughout the years.
By 1994, the married couple percentage rose roughly more than 1 point in Denmark (from 5 to 6.5), however, the number of divorced couples had slightly changed (from 2.5 to 2). Thus, it can be said that Denmark is the only country the percentage of married couples increased.
Reply
georgia
Posted on Mar 15, 2022
The bar charts depict the information about the number of married people and the divorced population in 8 countries which are the USA, UK, Japan, Finland, Germany, France, Italy, Denmark, respectively, between 1981 and 1994. Calibration of data is done in per thousands.
Overall, it can be clearly seen from the first chart, marriage statistics tend to decline profoundly in all represented countries during the given 13 years, except Denmark. In addition, according to the second chart which is demonstrated divorce statistics, America has the highest proportion and followed by Britain.
To begin with, the United States has the greatest number of married people which is over 10 per thousand in 1981. However half of these people had divorced in the same year. While the USA has a decreasing trend, Denmark has upward with around 2 per thousand people for marriage in the given period of time.
Moreover, it is clear that the other 5 countries have approximately the same trend for marriage. The eye-catching point of the second chart is that Italian society divorced less than other nations from 1981 to 1994.
Reply
georgia
Posted on Mar 15, 2022
The bar charts depict the information about the number of married people and the divorced population in 8 countries which are the USA, UK, Japan, Finland, Germany, France, Italy, Denmark, respectively, between 1981 and 1994. Calibration of data is done in thousands.
Overall, it is clearly seen from the first chart, marriage statistics tend to decline profoundly in all represented countries during the given 13 years, except Denmark. In addition, according to the second chart which is demonstrated divorce statistics, America has the highest proportion and followed by Britain.
To begin with, the United States has the greatest number of married people which is over 10 thousand in 1981. However half of these people had divorced in the same year. While the USA has a decreasing trend, Denmark has upward with around 2000 people for marriage in the given period.
Moreover, it is clear that the other 5 countries have approximately the same trend for marriage. The eye-catching point is that Italian society divorced less than other nations from 1881 to 1994.
Reply