Carbon Dioxide Emissions Per Person – IELTS Writing Task 1
Table of Contents

Try AI Essay Checker for Instant Band Score
The Writing module of IELTS is divided into two parts – Task 1 and Task 2. You will be expected to write a paragraph on a visual representation or a diagram for IELTS Writing Task 1 in the IELTS Academic. Line graphs may be one of several graphical forms. Here, we will write a report based on a line graph that shows average carbon dioxide emissions per person.
Before going through the sample answer to learn the way the answer is written for a line graph, go through tips and sample questions to solve this type of question.
Steps to Remember
Writing a report in the IELTS exam requires a structured approach to effectively present information and analysis. Here are the steps to write a report for IELTS Writing Task 1:
Step 1: Understand the Question Prompt
Carefully read the essay prompt to ensure you understand the topic, the specific question being asked, and any instructions or guidelines provided.
Step 2: Plan Your Response
Take a few minutes to brainstorm and plan your essay. Consider the key points you want to include in your report and the overall structure of your essay.
Step 3: Write the Introduction
Begin your essay with a clear and concise introduction. Start with a brief overview of the topic or issue you will be addressing. Include the purpose of your report and a preview of the main points you will discuss.
Step 4: Present the Information
In the body of your report, present the information in a logical and organized manner. Use headings and subheadings to divide the content into sections. Provide detailed information, facts, data, or findings related to the topic. Use clear and concise language to convey the information.
Step 5: Analyze the Information
Analyze the information you’ve presented in the report. Identify patterns, trends, or relationships within the data. Draw conclusions or make recommendations based on your analysis.
Step 6: Write the Conclusion
Summarize the key findings or points from your report. Restate the purpose of the report and any conclusions or recommendations you’ve made. Avoid introducing new information in the conclusion.
Step 7: Proofread and Edit
Carefully review your report for grammatical errors, spelling mistakes, and clarity. Ensure that the information is well-organized and follows a logical flow.
Question
Take a look at the IELTS sample line graph and see how it has been organised.
You should spend about 20 minutes on this task.
Summarize the information by selecting and reporting the main features, and make comparisons where relevant.
Write at least 150 words.

Report Plan
|
Sample Answer
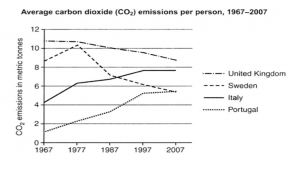
The line graph illustrates the average carbon dioxide emissions that people in four different nations – the United Kingdom, Sweden, Italy and Portugal – between 1967 and 2007 generated.
Overall, average CO2 emissions from people in the U.K. and Sweden decreased, but emissions from residents in Italy and Portugal dramatically increased. Despite the continuous decline, U.K. common emissions during these 40 years were the highest.
Nearly 11 metric tonnes were emitted per person on average in 1967 in the U.K. However, by 2007, that had decreased to about 9 metric tonnes. Comparatively, in 1967, Sweden’s average CO2 emissions per person were close to 9 metric tonnes. Although the emissions peaked in 1977 at around 11 metric tonnes, they then steadily decreased until they reached just 5.5 metric tonnes in 2007.
On the other hand, between 1967 and 2007, carbon dioxide emissions per person rose in Portugal and Italy. Starting at slightly over 4 metric tonnes in 1967 and finishing at almost 8 metric tonnes four decades later, Italy’s CO2 emissions nearly doubled. Meanwhile, Portugal’s CO2 emissions almost doubled. While in 1967, the average per person was only 1.5 metric tonnes, in 2007, the emissions matched Sweden’s average at 5.5 metric tonnes.
Sign Up to get more information on the IELTS exam!
Vocabulary
- Illustrates (Verb)
Meaning: To show or demonstrate something clearly.
Eg: The line graph illustrates the changes in CO2 emissions over the years.
- Emissions (Noun)
Meaning: The release or discharge of gases or substances, often into the atmosphere.
Eg: Carbon dioxide emissions have a significant impact on global warming.
- Dramatically (Adverb)
Meaning: In a sudden, striking, or remarkable manner.
Eg: The cost of renewable energy has dramatically decreased in recent years.
- Decline (Noun)
Meaning: A decrease or reduction in quantity or quality.
Eg: There has been a significant decline in the use of fossil fuels.
- Steadily (Adverb)
Meaning: In a regular, even, and continuous manner.
Eg: The company’s profits have been steadily increasing.
- Per capita (Phrase)
Meaning: For each individual or person.
Eg: Carbon emissions per capita vary widely between countries.
- Peaked (Verb)
Meaning: Reached the highest point or maximum level.
Eg: The demand for the product peaked during the holiday season.
- Matched (Verb)
Meaning: Corresponded or equaled in value or quantity.
Eg: Portugal’s CO2 emissions in 2007 matched Sweden’s average levels.
Looking for more insights on the Writing Task 1?
Check out our informative blog!
Have you got a quick report in your mind for the question we discussed?
Don’t hesitate to post the same in our comment section. We will evaluate the report/letter and email you the band score & our trainer’s comments.
Practice IELTS Writing Task 1 based on report types

Start Preparing for IELTS: Get Your 10-Day Study Plan Today!
Recent Articles

Nehasri Ravishenbagam

Nehasri Ravishenbagam

Kasturika Samanta


Post your Comments