Changes in Annual Spending by a Particular UK School- Pie Chart
5 min read
Updated On
-
Copy link
Explore the IELTS Writing Task 1 pie chart “Changes in Annual Spending by a Particular UK School” with 3 sample answers, full reports, and key vocabulary to help you describe trends, make comparisons, and boost your Writing score.

Table of Contents

Try AI Essay Checker for Instant Band Score
The IELTS Writing Task 1 “Changes in Annual Spending by a Particular UK School - Pie Chart” asks candidates to describe and interpret data presented in a pie chart, showing how a school’s spending patterns have changed over time. This article provides 3 sample answers, along with complete reports and useful vocabulary, to help candidates organize their ideas, use accurate language for comparisons and trends, and achieve a higher IELTS Writing score.
Question
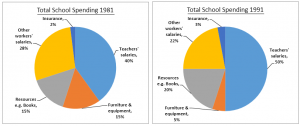
The three pie charts below show the changes in annual spending by a particular UK school in 1981, 1991 and 2001.
You should spend about 20 minutes on this task.
Summarise the information by selecting and reporting the main features, and make comparisons where relevant.
You should write at least 150 words.
Report Plan
Paraphrase: Paraphrase the topic sentence and use synonyms.
Overview: Mention the main features of the pie charts and give an overview of the information provided.
Paragraph 1: Elaborate on the changes in annual spending of a school in the UK in the years 1981, 1991, 2001.
Paragraph 2: Elaborate on the changes in annual spending of a school in the UK in the years 1981, 1991, 2001.
Learn the Best IELTS Writing Task 2 Tips for Achieving Band 9 Score!
Changes in Annual Spending by a Particular UK School - Sample Answer 1
The pie charts depict the annual expenditure by a school in the UK in 3 different years which are 1981, 1991 and 2001.
There were numerous changes in the annual spending pattern of this school in the UK. There weren’t many major changes in the annual expenditure between 1981 and 1991 apart from the expenditure on furniture and equipment and teachers’ salaries. However, the changes in the annual expenditure were significant in 2001.
Other workers’ salaries were the only category which followed a consistently decreasing trend where it contributed 28% in 1981, 22% in 1991 and 15% in 2001 to the total yearly expenditure. Spending on furniture and equipment was quite fluctuating between the three years.
The expenditure on insurance increased in all three years whereas spending on resources like books and teachers’ salaries fluctuated over the years. Expenditure on academic resources increased from 15% in 1981 to 20% in 1991 but then it decreased to 9% in 2001. The spending on teachers’ salaries increased by 10% in 1991 but then decreased by 5% in 2001.
Visit IELTS eBooks store for top-rated books & elevate your IELTS preparation!
Changes in Annual Spending by a Particular UK School - Sample Answer 2
The pie charts illustrate the annual expenditure of a UK school in the years 1981, 1991, and 2001.
Overall, there were several notable changes in the school’s spending patterns over these three decades. While expenditures remained relatively stable between 1981 and 1991, significant shifts occurred by 2001.
Salaries for other staff showed a consistent decline, dropping from 28% in 1981 to 22% in 1991, and further to 15% in 2001. Spending on furniture and equipment fluctuated across the three years, with no clear trend. In contrast, insurance expenditure steadily increased over time.
Academic resources such as books rose from 15% in 1981 to 20% in 1991 but then fell sharply to 9% in 2001. Teachers’ salaries also experienced fluctuations, increasing by 10% in 1991 before decreasing by 5% in 2001. These changes highlight the school’s evolving priorities in allocating its annual budget.
Come learn proven tips for handling IELTS Writing in our Free IELTS Webinar!
Changes in Annual Spending by a Particular UK School - Sample Answer 3
The given pie charts compare how a particular UK school allocated its annual budget in 1981, 1991, and 2001.
It is clear that spending patterns changed over the period, with the most dramatic differences occurring in 2001. Between 1981 and 1991, the overall distribution remained fairly steady, except for slight variations in teachers’ salaries and furniture/equipment costs.
Expenditure on other staff salaries consistently decreased from 28% in 1981 to 15% in 2001. In contrast, insurance costs gradually increased during the same period. Spending on books and teachers’ salaries showed more volatility: academic resources rose from 15% in 1981 to 20% in 1991, then dropped to 9% in 2001, while teachers’ salaries increased in 1991 before falling again in 2001.
These trends indicate that the school gradually shifted its focus toward insurance and other essential expenditures while reducing allocations for staff and some educational resources.
Get help from IELTS Experts to Ace IELTS Writing Essays! Sign up for a FREE demo now!
Changes in Annual Spending by a Particular UK School - Vocabulary
The following are some of the IELTS Vocabulary found in the above writing sample answers.
- Depict / Illustrate / Compare – used to paraphrase the topic sentence.
Example: The pie charts illustrate the annual expenditure of a UK school in 1981, 1991, and 2001. - Expenditure / Spending / Budget allocation – key nouns for describing amounts of money.
Example: Expenditure on academic resources increased from 15% to 20%. - Trend / Pattern / Distribution – for describing overall movement in the data.
Example: Other staff salaries followed a consistently decreasing trend. - Increase / Rise / Grow / Surge – to describe upward movement.
Example: Insurance costs gradually increased over the period. - Decrease / Fall / Drop / Decline – to describe downward movement.
Example: Other workers’ salaries dropped from 28% to 15%. - Fluctuate / Vary / Be volatile – to describe irregular changes.
Example: Spending on furniture and equipment fluctuated between the three years. - Steady / Consistent / Stable – for minimal or no change.
Example: Between 1981 and 1991, overall spending remained relatively stable. - Significant / Dramatic / Notable – for emphasizing large changes.
Example: Significant shifts occurred in 2001. - Allocate / Distribution / Portion / Share – to talk about assigning amounts.
Example: The school gradually shifted its focus toward insurance and other essential allocations. - Highlight / Indicate / Show / Reflect – to explain the importance or meaning of changes.
Example: These trends highlight the school’s evolving priorities.
Try our Free IELTS Writing Essay Evaluation and Correction Service! Get expert feedback and boost your score.
In conclusion, the IELTS Writing Task 1 pie chart “Changes in Annual Spending by a Particular UK School” gives candidates an opportunity to demonstrate their ability to describe proportions, trends, and comparisons. By reviewing the 3 sample answers, using the suggested vocabulary, and practicing data interpretation, candidates can improve clarity, coherence, and accuracy, ultimately enhancing their overall Writing Task 1 score.
Also check:
- 21+ Tips On How to Improve Your IELTS Writing Band Score
- Best IELTS Writing Task 2 Tips for Achieving Band 9
- IELTS Writing Task 2 Sample Essays
- Demand for Electricity in England- Line Graph and Pie Chart
- Average Household Expenditures in a Country in 1950 and 2010- Pie Chart
- Methods of Transportation for People Traveling to a University – Pie Chart
- Percentage of Water Used for Different Purposes in Six Areas of the World- Pie Chart
- Online shopping sales for retail sectors in Canada – IELTS Writing Task 1 Pie chart
Practice IELTS Writing Task 1 based on report types

Start Preparing for IELTS: Get Your 10-Day Study Plan Today!

Recent Articles

Nehasri Ravishenbagam


Nehasri Ravishenbagam

Kasturika Samanta


Post your Comments