Consumption of Fish and Different kinds of Meat in a European Country- Line Graph
1 min read
Updated On
-
Copy link
Table of Contents

Try AI Essay Checker for Instant Band Score
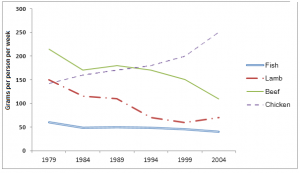
The graph below shows the consumption of fish and different kinds of meat in a European country between 1979 and 2004.
You should spend about 20 minutes on this task.
Summarise the information by selecting and reporting the main features and making comparisons where relevant.
Write at least 150 words.

Report Plan
Paraphrase: Paraphrase the topic sentence using synonyms.
Overview: Mention the main characteristics of the graph and give an overview of the information provided.
Paragraph 1: Elaborate on the different trends in meat consumption of the given country.
Paragraph 2: Elaborate on the different trends in meat consumption of the given country.
Sample Answer
The given line graph depicts the different trends in the consumption of different types of non-vegetarian food items in a European country between 1979 and 2004.
It is clear from the graph that chicken was the most consumed meat type in this country, followed by beef. The consumption of lamb and fish respectively was the least among all.
Initially, in 1979, beef was the most consumed meat item in this country, after which its consumption fell. The use of chicken meat followed an upward trend and there was a sharp rise in consumption after 1999.
Lamb meat was the second most consumed item in 1979, after which its consumption mostly declined. Apart from 1989, where the quantity increased a little, the use of lamb meat dropped till 1999 when it started rising again. The consumption of fish was marginal in this country, and its preference gradually declined over the years.
Practice IELTS Writing Task 1 based on report types

Start Preparing for IELTS: Get Your 10-Day Study Plan Today!
Recent Articles

Nehasri Ravishenbagam

Nehasri Ravishenbagam

Kasturika Samanta


Post your Comments