Rural Households Had Internet Access between 1999 and 2004 - IELTS Writing Task 1 Bar Graph
4 min read
Updated On
-
Copy link
Get familiar with the structure for the IELTS Writing Task 1 Bar Graph with the topic, ‘Rural Households Had Internet Access between 1999 and 2004’. Practice with the report plan, sample answers, and academic vocabulary terms to excel in the exam.
Table of Contents

Try AI Essay Checker for Instant Band Score
The bar graph, ‘Rural Households Had Internet Access between 1999 and 2004’, requires you to analyze numerical data where you must describe the primary trends which you would observe. Since you have only 20 minutes to complete this IELTS Writing task, you need to use effective time management skills along with a structured approach to answer. With time, you can improve your ability to identify important comparisons and organize them in a logical way while learning to use academic language correctly.
Question - IELTS Writing Task 1 Bar Graph ‘Rural Households Had Internet Access between 1999 and 2004’
You should spend about 20 minutes on this task.
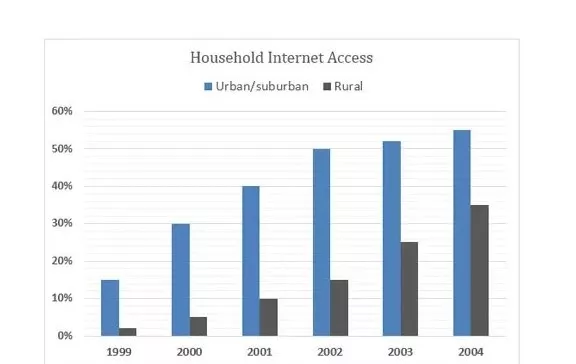
The graph below shows the percentage of urban/suburban and rural households in a European country that had Internet access between 1999 and 2004.
Summarize the information by selecting and reporting the main features, and make comparisons where relevant.
You should write at least 150 words.
Report Plan on ‘Rural Households Had Internet Access between 1999 and 2004’
It is important to first arrange the essential bar graph data before you start writing your answer so that the information given in the IELTS Bar Charts is structured. The identification of main trends and important comparisons would help you to note down the major figures and achieve higher band score. The following section presents a sample report plan that demonstrates how to organise information from a bar graph before transforming it into a well-structured response.
|
Check the video below and learn the techniques for Understanding IELTS Writing Task 1 ACADEMIC in 20 Minutes.
Sample Answer 1 on ‘Rural Households Had Internet Access between 1999 and 2004’
The bar graph depicts the availability of internet access in both rural and urban households in a European country from 1999 to 2004.
The availability of internet access was always higher in urban and suburban households. Rural areas also started gaining access to the Internet over the years.
Around 15% of the households in the urban and suburban areas of this country had internet access in 1999. This percentage grew strongly and 30% of the households had internet access in 2000. Subsequently, the number of households with internet access rose greatly in 2001 and 2002. Thereafter, the rate of growth was relatively lower.
As for the rural households, the number of households with internet access was negligible in 1999. This number increased gradually, reaching 10% in 2001 and around 15% in 2002. The rate grew sharply in both 2003 and 2004. Internet accessibility grew by 10% in both years for rural areas.
Sample Answer 2 on ‘Rural Households Had Internet Access between 1999 and 2004’
The bar graph shows the Internet access rates between 1999 and 2004 in both rural and urban households. Overall, online service usage in towns reached higher levels than rural areas during the entire observation period.
In 1999, only 13% of city residents used the Internet which resulted in a tenfold difference when compared to 3% of rural residents who accessed online services. Later, Internet access rights extended to 2000 households who got the connection. Due to this, it resulted in higher Internet usage rates among rural users who accessed the Internet in 2000.
The Internet usage rate for town residents reached its highest point during 2001 while the usage among rural users increased by 2% during the year 2001. The Internet usage rate for town residents reached its highest point during 2001 while Internet usage among rural users increased by 2% during 2001.
The Internet usage rate for urban households reached 52% in 2003 which marked a twofold increase from the rural Internet usage rate for the same year. The Internet usage gap between urban households and rural families showed significant decrease which reached its lowest point during 2004.
Connect with our band 9 IELTS Trainers to crack your IELTS Exam in no time! Book a FREE Demo.
Vocabulary on ‘Rural Households Had Internet Access between 1999 and 2004’
-
Access
Meaning – opportunity to use enter somewhere
Example – The new highway provides better access to all suburban areas which the city limits.
-
Suburban
Meaning – people living outside the main city centre
Example – Suburban neighbourhoods attract many families because they offer more peaceful living conditions than city centers.
-
Negligible
Meaning – Something which is being ignored because it is small or unimportant
Example – The two regions showed no differences in population growth which reached negligible levels.
-
Tenfold
Meaning – a quantity which increases to ten times its initial value
Example – The company experienced a tenfold increase in profits after it entered international business operations.
-
Twofold
Meaning – a quantity which becomes double its original value through its two separate components
Example – The new policy aims to achieve towfold by the end of this year.
-
Significant
Meaning – something which has enough importance to create a visible impact
Example – The number of students who applied for higher education institutions experienced a significant increase.
Join our IELTS online classes for expert guidance. Sign up today!
As you practice with different topics, you will see an improvement in your ability to recognize patterns and choose the important aspects given in the bar graph questions. Along with it, you will get an opportunity to learn new academic terms which will increase your proficiency. Therefore, learn to use your time efficiently as you develop an organized answer for the IELTS Exam.
More Writing Task 1 Topics
|
Annual Pay for Doctors and Other Workers - IELTS Writing Task 1 Bar Chart |
Southland’s Main Exports in 2000 and Future Projections For 2025 – IELTS Writing Task 1 |
Also Check:
Practice IELTS Writing Task 1 based on report types

Start Preparing for IELTS: Get Your 10-Day Study Plan Today!

Explore other sample Bar Charts


Recent Articles

Nehasri Ravishenbagam


Nehasri Ravishenbagam

Kasturika Samanta


Post your Comments