How to Identify The Key Features in The IELTS Charts?
5 min read
Updated On
-
Copy link

Limited-Time Offer : Access a FREE 10-Day IELTS Study Plan!
In the IELTS Academic Writing Task 1, interpreting charts is a crucial skill that can significantly impact your overall score. To excel in this task, it is essential to identify and highlight the key features effectively.
In this comprehensive guide, we will explore expert strategies to find key features in IELTS Academic charts, including essential tips for providing a clear and concise overview.
Understanding IELTS Charts
Before diving deep into identifying key features, let’s first understand the different types of IELTS Academic charts that you may come across!
Types of IELTS Academic Charts
There are 3 types of IELTS Charts for the academic module. Let’s see a brief about each one of them.
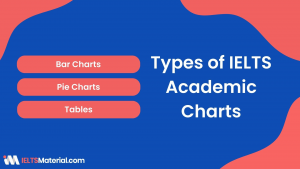
Bar Charts: These Bar charts use rectangular bars to compare different categories and their quantities. An example of an IELTS Writing Task1 Bar chart is given below for you.
| The bar chart below shows the total number of minutes (in billions) of telephone calls in Australia, divided into three categories, from 2001- 2008. Summarise the information by selecting and reporting the main features and make comparisons where relevant. Write at least 150 words. |

Pie Charts: Pie charts present data as slices of a circle, representing the proportions of a whole. An example of an IELTS Pie chart is given below for you.
| The charts below show the percentage of water used by different sectors in Sydney, Australia, in 1997 and 2007. Summarize the information by selecting and reporting the main features, and make comparisons where relevant. |

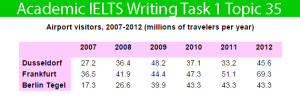
Tables: Tables organize data in rows and columns, providing a structured layout for presenting various categories and their respective data points. An example of an IELTS Writing Task 1 Table is given below for you.
| The table below highlights data on the number of travellers using three major German airports between 2007 and 2012. Summarize the information by selecting and reporting the main features, and make comparisons where relevant. Write at least 150 words. |
How to Find Key Features in IELTS Academic Charts?
Successfully identifying key features in IELTS Academic charts involves a systematic approach and keen observation. Here are essential steps to guide you through the process:
- Analyze the Chart Title and Labels
Begin by thoroughly reading the chart title and axis labels. The title provides essential information about the topic, while the axis labels offer insights into the data’s categories and units of measurement. Understanding these components will set the foundation for your analysis.
- Look for Main Trends and Comparisons
Next, examine the main trends and significant comparisons within the chart. Look for high and low points, significant increases or decreases, and any patterns that stand out. These trends will likely represent key features in the data and should be highlighted in your response.
- Identify the Most Prominent Data Points
Pay attention to data points that stand out due to their magnitude or significance. These data points may represent extremes, turning points, or unique observations. Identifying and describing them will enhance the depth of your analysis.
- Determine Relationships and Correlations
Explore the relationships and correlations between different data sets or categories. Analyze how one variable affects another and identify any co-relations that may emerge. Understanding these connections will help you identify additional key features in the chart.
- Including Key Features in the Overview
The overview is a critical component of IELTS Academic Writing Task 1. It provides a concise summary of the main features in the chart.
- Summarize the Main Trends
Begin your overview by summarizing the main trends evident in the chart. Mention the most significant changes or patterns, ensuring your summary remains accurate and to the point.
- Highlight Key Comparisons
Emphasize key comparisons between data sets or categories that are relevant to the chart’s overall message. This will demonstrate your ability to identify the most critical information in the data.
- Include Data Ranges and Extremes
Incorporate information about any data ranges, turning points, or extremes that significantly impact the chart’s interpretation. This will showcase your proficiency in recognizing crucial data points.
Aspiring to Crack the IELTS Academic Writing? Our Best-Selling Writing Ebook Has Come to your Rescue!

Bonus Tips to Excel in IELTS Academic Task 1: Charts
Here are some star tips to enhance your performance in IELTS Academic Writing Task 1:
- Practice Regularly with Various Charts
Familiarize yourself with different chart types and practice analyzing and describing them regularly. The more exposure you have to different charts, the more comfortable you will be in identifying key features.
- Develop a Structured Approach
Establish a systematic approach to analyzing charts. This may involve starting with the chart’s title and labels, identifying trends, highlighting significant data points, and then forming an overview.
- Make use of relevant vocabulary
Using precise and relevant vocabulary showcases language proficiency and ensures clarity in data analysis in Academic Writing Task 1. Learn key terms related to chart interpretation, such as “fluctuate,” “significant,” and “dramatic changes.” Practice using them in your responses to convey information accurately and boost your chances of success in the IELTS exam.
Mastering the art of identifying key features in IELTS academic charts is an essential skill for success in Writing Task 1. By following a structured approach, analyzing trends, and emphasizing significant data points, you can confidently present a clear and concise overview. Remember to practice regularly and incorporate relevant vocabulary to demonstrate your proficiency in chart interpretation and data analysis.
Get expert help today with a FREE demo session! Sign up, Now!
Also Check:
- Latest IELTS Writing Task 1?| Samples,Questions and Answers
- IELTS Academic Writing Task 1: Useful Tips and Vocabulary to Describe a Graph or Chart
- IELTS Writing Task 1 Topics with Model Answers
Explore IELTS related articles

Start Preparing for IELTS: Get Your 10-Day Study Plan Today!
Recent Articles

Nehasri Ravishenbagam

Nehasri Ravishenbagam

Haniya Yashfeen



Post your Comments