Projected Population Growth of China and India - IELTS Writing Task 1 Line Graph
4 min read
Updated On
-
Copy link
Hone your writing skills with the IELTS Writing Task 1 Line Graph on ‘Projected Population Growth of China and India’. Check out the report plan, sample answers, and high-frequency vocabulary words for achieving a band 8+.
Table of Contents

Try AI Essay Checker for Instant Band Score
Describing the data in a line graph on topics such as ‘Projected Population Growth of China and India’ can seem like one of the most complicated tasks in the IELTS Writing module. However, with the right strategy, report plan, and structure, you can write a band 8+ answer. Remember that the Line Graph in the IELTS Writing section is the ideal format for practicing and learning how to logically and simply organize all components. By diving into the sample answers, you will get familiar with the layout, the figures, the contrasts, and the similarities.
Question - IELTS Writing Task 1 Line Graph ‘Projected Population Growth of China and India’
You should spend about 20 minutes on this task.
The line graph shows the projected population growth of China and India.
Summarise the information by selecting and reporting the main features, and make comparisons where relevant.
Write at least 150 words.
Report Plan on ‘Projected Population Growth of China and India’
As you attempt the question on IELTS Writing Task 1 - Line Graph, you must start your writing process after developing an effective report plan. Such an organized plan would guide you to use appropriate information and arrange them loically while making your answer look more structured. The following is a report plan for the line graph on ‘Projected Population Growth of China and India’, which will help you to fulfill assessment requirements for coherence and cohesion.
|
Check the video below and learn the techniques for Understanding IELTS Writing Task 1 ACADEMIC in 20 Minutes.
Sample Answer 1 on ‘Projected Population Growth of China and India’
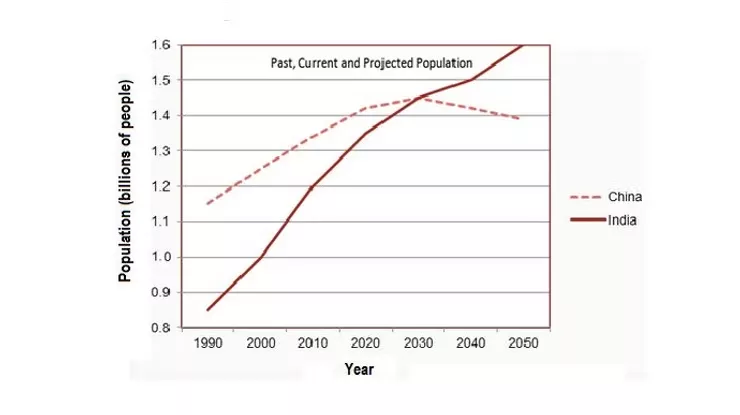
The given line graph depicts the trajectory of population growth in China and India from 1990 and provides projections for population growth till 2050.
The initial population of India was significantly lower than that of China, but the rate of population growth was similar for both countries. There is no significant change predicted in the population growth for India, but the same for China will drop after 2030.
The population of China was more than 1.1 billion in 1990, whereas that of India was between 0.8 and 0.9 billion. Both countries had a high population growth rate, and there was a substantial growth in population every decade. Around 2020, the population growth rate of China became slower, whereas for India, it did not change noticeably.
The population growth in India will keep increasing beyond 2050 at relatively the same rate. By 2030, China’s population growth rate will plummet, and the population will fall slightly below 1.4 billion by 2050.
Sample Answer 2 on ‘Projected Population Growth of China and India’
The line graph depicts the projected population growth pattern of China and India..
Overall, India experienced more severe population growth which will continue to increase uncontrollably while China will achieve positive population decline results after 2030.
The first stage of 1990 showed a major population difference between India and China which continued until the next period. The following years brought consistent population growth to both nations. India reached a population peak of 1.6 billion while China had a population of 1.45 billion. However, China experienced an uncommon pattern of population expansion where the population will reach its peak in 2030 before it starts to decline after that year.
Moreover, the two lines depicting the population of both the countries intersect each other in 2030 which implies that the population remained same during this year. The lowest population that India and China encountered was in 1990 even though the number was much higher for China. The highest population will be noticed in 2050 for India and 2030 for China.
Connect with our band 9 IELTS Trainers to crack your IELTS Exam in no time! Book a FREE Demo.
Vocabulary on ‘Projected Population Growth of China and India’
-
Trajectory
Meaning – describes how something progresses over time
Example – There is an upward trajectory of internet users around the word since the last decade.
-
Substantial
Meaning – things that possess significant worth
Example – The company saw a substantial growth in their profits after launching a new product in the market.
-
Plummet
Meaning – a sudden drop
Example – During covid, the number of tourists plummeted due to travel restrictions.
-
Peak
Meaning – the highest point
Example – Every year, the tourism industry witness a peak during Chistmas holidays.
-
Expansion
Meaning – to become larger through increased size
Example – Due to urban expansion, the demand for housing has increased.
-
Intersect
Meaning – situation where two entities meet each other at one specific location
Example – They took another road which intersect near the city centre.
Join our IELTS online classes for expert guidance. Sign up today!
It is important to identify major trends and then start with the data comparison methods while using vocabulary to explain the changes. With consistent practice, you can focus on developing your observation abilities while managing your time efficiently. By practising, you can boost your dedication and get familiar with the correct strategy so that you can handle line graph questions during the IELTS Exam.
More Writing Task 1 Topics
Also Check:
Practice IELTS Writing Task 1 based on report types

Start Preparing for IELTS: Get Your 10-Day Study Plan Today!

Explore other sample Bar Charts


Recent Articles

Nehasri Ravishenbagam


Nehasri Ravishenbagam

Kasturika Samanta


Post your Comments