Waste Recycling Rates in the U.S. From 1960 to 2011- Line Graph
4 min read
Updated On
-
Copy link
Explore how to describe line graphs in IELTS Writing Task 1 with an example on waste recycling rates in the U.S. from 1960 to 2011. Learn tips for identifying trends, comparing data, and writing clear conclusions.
Table of Contents

Try AI Essay Checker for Instant Band Score
The line graph is a common and sometimes challenging task in the IELTS Writing Task 1 module. Without a clear structure and understanding of trends, candidates may find it difficult to present information accurately. Line graphs are particularly useful for illustrating changes over time, as they clearly display patterns, increases, and decreases. Key features of a line graph include the title, time period, scale, and data points.
The line graph below shows waste recycling rates in the United States from 1960 to 2011, highlighting how the percentage of recycled waste changed over this period.
Question
The graph below shows waste recycling rates in the U.S. from 1960 to 2011.
You should spend about 20 minutes on this task.
Summarise the information by selecting and reporting the main features, and make comparisons where relevant.
You should write at least 150 words.
National Recycling Rates, US, 1960 to 2011
Report Plan
Paraphrase: Paraphrase the topic sentence.
Overview: Mention the main features of the line graph and give an overview of the information provided.
Paragraph 1: Elaborate on the total waste recovery in the U.S. from 1960 to 2011.
Paragraph 2: Elaborate on the waste recycling rates in the U.S. from 1960 to 2011.
Learn the Best IELTS Writing Task 2 Tips for Achieving Band 9 Score!
Waste Recycling Rates in the U.S. From 1960 to 2011 - Sample Answer 1
The line graph depicts the trends in waste recycling rates in the U.S. from 1960 to 2011.
The amount of waste recovered in the United States followed a gradually rising trend from 1960 to 2011. The percentage of waste recycled also increased, but there was a lot of waste left unrecycled.
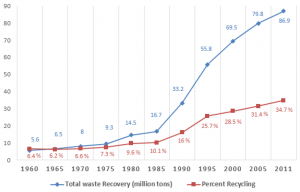
Initially, the quantity of waste produced was comparatively less, especially from 1960 to 1975, when the total waste recovery was under 10 million tons. The total waste generated started rising and grew drastically after 1985 reaching 86.9 million tons by 2011.
As for the amount of waste recycled, it followed a slowly rising pattern from 6.4% in 1960 to 10.1% in 1985. There was a rise in the percentage of waste recycled from 1990 and this amount increased and reached 34.7% in 2011, which was the highest amount of waste recycled in the given time period, although this percentage of waste recycled is quite low.
Waste Recycling Rates in the U.S. From 1960 to 2011 - Sample Answer 2
The line graph illustrates changes in waste recovery and recycling rates in the United States between 1960 and 2011.
Overall, both the total amount of waste recovered and the proportion recycled increased significantly over the period. However, despite this upward trend, a substantial quantity of waste continued to remain unrecycled throughout the timeframe.
In the early decades, waste recovery levels were relatively modest. From 1960 to 1975, the total amount of waste recovered remained below 10 million tons, indicating limited recycling activity. This figure began to rise gradually after 1980 and then increased sharply from the mid-1980s onwards. By 2011, waste recovery had reached a peak of 86.9 million tons, representing a dramatic growth compared with earlier years.
A similar but slower trend can be observed in recycling rates. In 1960, only 6.4% of waste was recycled, and this figure rose marginally to 10.1% by 1985. From 1990 onwards, the rate of recycling accelerated noticeably, eventually reaching 34.7% in 2011. Nevertheless, even at its highest point, the proportion of recycled waste remained comparatively low in relation to total waste production.
Come learn proven tips for handling IELTS Writing in our Free IELTS Webinar!
Waste Recycling Rates in the U.S. From 1960 to 2011 - Sample Answer 3
The line graph presents data on waste recovery and recycling percentages in the U.S. over a 51-year period from 1960 to 2011.
In general, the graph shows a clear and sustained rise in both the volume of waste recovered and the share of waste recycled. Despite this progress, the majority of waste was still not recycled by the end of the period.
At the beginning of the timeline, waste recovery was minimal. Between 1960 and 1975, recovery levels stayed well below 10 million tons, reflecting limited recycling infrastructure. After 1985, however, recovery increased rapidly, with particularly sharp growth in the final decades. By 2011, the amount of recovered waste had climbed to nearly 87 million tons, the highest figure recorded.
Recycling rates followed a more gradual upward pattern. Starting at just 6.4% in 1960, the rate rose slowly and reached slightly above 10% by 1985. From 1990 onwards, recycling activity expanded considerably, culminating in a peak of 34.7% in 2011. Nonetheless, this figure indicates that a large proportion of waste continued to be disposed of rather than recycled.
Get help from IELTS Experts to Ace IELTS Writing Essays! Sign up for a FREE demo now!
In conclusion, the line graph provides a clear overview of waste recycling trends in the U.S. over the period 1960–2011. It highlights the main patterns in both waste recovery and recycling rates, making it easier to understand how recycling activity evolved over time and to draw meaningful insights from the data presented.
Also check:
Practice IELTS Writing Task 1 based on report types

Start Preparing for IELTS: Get Your 10-Day Study Plan Today!

Recent Articles

Nehasri Ravishenbagam


Nehasri Ravishenbagam

Kasturika Samanta


Post your Comments