Division of Household Tasks by Gender in Great Britain - IELTS Writing Task 1 (Bar Graph)
7 min read
Updated On
-
Copy link
Be prepared to master IELTS bar graphs through this guide on Division of Household Tasks by Gender in Great Britain IELTS Academic Writing Task 1’. Analyze the outline, explore sample answers, & learn how to describe data to boost your writing band score.

Table of Contents
- Question for Division of Household Tasks by Gender in Great Britain - IELTS Academic Writing Task 1
- Outline for IELTS Writing Task 1 Bar Chart
- Sample Answers on 'Division of Household Tasks by Gender in Great Britain'
- Tips for IELTS Writing Task 1 Bar Chart - Division of Household Tasks by Gender in Great Britain

Try AI Essay Checker for Instant Band Score
In an era of increasing discussions about gender equality, the division of domestic chores remains a revealing indicator of societal roles and expectations. In the IELTS bar chart topic, ‘Division of Household Tasks by Gender in Great Britain IELTS Writing Task 1’, you will find a visual representation of various activities and gender disparities. Throuhg this question, your ability to describe, compare, and summarise quantitative data clearly and accurately will be assessed.
In this blog, you will find an outline of how to craft a Band 9 IELTS Academic Writing Task 1 answer, 3 sample answers on ‘Division of Household Tasks by Gender in Great Britain, and vocabulary and grammar tips related to IELTS bar chart writing sample answers.
Question for Division of Household Tasks by Gender in Great Britain - IELTS Academic Writing Task 1
You should spend about 20 minutes on this task.
The chart shows the division of household tasks by gender in Great Britain. Summarise the information by selecting and reporting the main features, and make comparisons where relevant.
Write at least 150 words.
Outline for IELTS Writing Task 1 Bar Chart
Given below is a detailed structure that will assist you in organizing your answer for IELTS Writing Task 1 bar charts.
|
Need expert advice on tackling IELTS bar charts?
Book a free trial & talk to our experts NOW!
Sample Answers on 'Division of Household Tasks by Gender in Great Britain'
The bar graph for ‘Division of Household Tasks by Gender in Great Britain IELTS Writing Task 1’ typically illustrates how much time men and women in Great Britain spend per week on various household chores such as cooking, cleaning, laundry, gardening, and repairs. The values are generally measured in hours per week, and the contrast between male and female contributions highlights traditional and modern gender roles within the domestic sphere.
Now let us have a look at the sample answers for 'Division of Household Tasks by Gender in Great Britain' below, which will give you an idea of how to frame your IELTS Academic Writing Task 1 answers with clarity.
Division of Household Tasks by Gender in Great Britain - Sample Answer 1
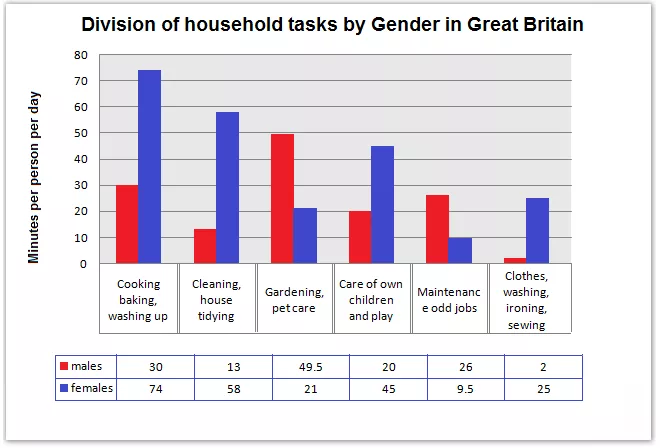
The bar graph portrays the division of household chores by gender in Great Britain. The unit of measurement is minutes per person per day.
Most household tasks are predominantly taken care of by women in Great Britain. Women also spend more time per day doing household work than men.
Tasks like cooking, baking, etc. are mostly taken care of by women with 74 minutes spent per person per day whereas men spend 30 minutes per person per day on such tasks. Women also significantly surpass men in cleaning, house tidying and household laundry. Women spend 45 minutes per person per day taking care of children whereas men spend 20 minutes on the same.
Men spend more time than women in gardening and pet care, where the time spent per person per day for men is 49.5 minutes, and that of women is 21 minutes. Men also spend more time doing maintenance jobs with 26 minutes per person per day, whereas women only spend 9 minutes.
Get expert feedback for your answers with get improvement tips
All you need to do is submit your IELTS Writing Essay for evaluation!
Division of Household Tasks by Gender in Great Britain - Sample Answer 2
The bar chart illustrates the average number of hours per week that men and women in Great Britain spent on different household chores. Overall, women spent significantly more time on most domestic tasks, especially cooking and cleaning, while men were more involved in maintenance work and gardening.
In terms of cooking, cleaning, and childcare, women contributed far more hours than men. Women spent nearly 13 hours per week on cooking, compared to only 5 hours for men. Similarly, in cleaning, women spent approximately 7 hours, while men did only around 2.5 hours. A similar trend was observed in laundry and childcare, where women’s contribution was more than double that of men.
On the other hand, men spent more time on gardening and household repairs. They did nearly 4 hours of gardening and 2 hours of repairs per week, while women’s involvement in these was relatively low, at around 2 and 0.5 hours, respectively. In summary, while women dominated most domestic chores, men mainly participated in outdoor or manual household tasks.
Join a FREE online webinar to learn how to deal with IELTS bar graphs for IELTS success!
Division of Household Tasks by Gender in Great Britain - Sample Answer 3
The bar graph compares the average weekly hours spent by men and women in Great Britain on eight different household tasks.
It is immediately evident that women dedicated significantly more time to domestic chores overall, especially in areas such as cooking, cleaning, and childcare, whereas men were more engaged in outdoor or technical tasks such as gardening and repairs.
Women spent over twice as much time cooking (13 hours) and cleaning (around 7 hours) compared to men, who allocated just over 5 and 2.5 hours to these tasks respectively. A similar disparity is evident in tasks like laundry and childcare, with women investing nearly 6 and 5.5 hours per week, while male counterparts contributed less than half that time.
Conversely, men assumed greater responsibility for gardening and household repairs. They spent around 4 hours per week on gardening, nearly double that of women, and 2 hours on repairs, which was quadruple the time women dedicated to this task. Shopping and washing-up were more evenly distributed, with both genders contributing 2–3 hours weekly.
In conclusion, the chart highlights a clear gender divide in household responsibilities, with women predominantly managing indoor chores and caregiving, while men were more involved in physically demanding or outdoor duties.
Access the latest IELTS Writing Task 1 bar graphs with our IELTS Writing Task 1 Academic Course!
Tips for IELTS Writing Task 1 Bar Chart - Division of Household Tasks by Gender in Great Britain
To achieve a Band 9 score on the ‘Division of Household Tasks by Gender in Great Britain’ bar graph, you must go beyond simply describing figures. Let us check out some IELTS exam preparation tips for band score of 8+ in similar IELTS bar graphs.
- Use a wide range of topic-specific vocabulary: Avoid repeating basic words like ‘did’, ‘spent’, or ‘more’ throughout your answer. Instead, use varied IELTS vocabulary, verbs, and phrases related to time allocation, gender roles, and domestic tasks, like ‘outnumbered’, ‘dominated’, accounted for’, etc.
- Maintain clear comparisons using linking phrases: You should demonstrate the ability to compare genders and task types fluently, like ‘whereas’, ‘In contrast’, ‘compared to’, ‘while’, etc. These IELTS Writing Task 1 connectors organise your data-driven comparisons and elevate your logical flow.
- Include accurate data from the graph: Precision matters when it comes to IELTS Writing Task 1. So, avoid vague terms like ‘many’ or ‘a lot’. Use actual numbers from the graph, for example, ‘Women spent approximately 13 hours on cooking weekly, more than double the 5 hours reported for men’. It shows the examiner that you can extract, interpret, and communicate data accurately.
- Demonstrate a variety of sentence structures: Using a mix of simple, compound, and complex sentences adds fluency and style. Some examples of advanced grammar structures for IELTS to achieve band 7+ are:
-
- Simple: Men spent less time on childcare.
- Compound: Women did more cooking and cleaning, but men were more active in gardening.
- Complex: Although both genders participated in shopping, women still completed slightly more hours.
- Use passive voice and complex grammar where appropriate: Besides using a variety of sentence structures, it is also a bonus if you can use passive voice and noun clauses appropriately. They are useful in formal, objective descriptions and showcase your IELTS grammar prowess. For example:
-
- Passive: More time was spent on household repairs by men than by women.
- With clauses: The fact that men contributed fewer hours to domestic tasks reflects traditional gender roles.
In conclusion, to achieve a high band score in IELTS Academic Writing Task 1, it is essential to become familiar with interpreting various visual data types, including bar graphs like the one illustrating the division of household tasks by gender in Great Britain. Focus on comparing figures accurately, using varied sentence structures, and employing topic-specific vocabulary. Moreover, make sure to work through targeted IELTS Writing practice tests to refine your technique and boost your performance.
Useful Links:
- Percentage of People Living Alone in 5 Different Age Groups in the USA - IELTS Academic Writing Task 1 (Bar Chart)
- Information about Computer Ownership as a Percentage of the Population - IELTS Academic Writing Task 1 (Bar chart)
- IELTS Academic Writing Task 1: Useful Tips and Vocabulary to Describe a Graph or Chart
- 21+ Tips On How to Improve Your IELTS Writing Band Score
- Recent IELTS Writing Actual Test & Model Answers
- IELTS Writing Answer Sheet
Practice IELTS Writing Task 1 based on report types

Start Preparing for IELTS: Get Your 10-Day Study Plan Today!

Explore other Writing Practice Tests


Recent Articles

Nehasri Ravishenbagam


Nehasri Ravishenbagam

Kasturika Samanta


Post your Comments