The Number of Prisoners in Five Varying Countries – IELTS Academic Writing Task 1
4 min read
Updated On
-
Copy link
Here’s a chance to practice an IELTS Writing Task 1 Bar Chart question based on the topic “Number of Prisoners in Five Varying Countries.” Upon completion, you also get to read two sample answers along with expert tips for band 8 in your final test!

Table of Contents

Try AI Essay Checker for Instant Band Score
Tackling the IELTS Writing Task 1 can feel challenging, especially when you are presented with a detailed bar chart and only 20 minutes to turn it into a clear, well-structured report. However, with the right strategy, this writing task becomes much less intimidating and even more predictable.
In this article, we shall break down exactly how to understand and describe an IELTS Bar chart clearly in the exact way examiners expect you to. You will also learn how to spot important trends, compare key data points, and organise your writing logically and clearly.
Along the way, we will also share some practical and easy-to-apply tricks for you to crack your IELTS Writing Task 1 with confidence. Whether you are aiming for a Band 6 or pushing for a Band 8+, this blog should be your perfect pick. Let us begin!
Structure Breakdown
|
Question Type
Introduction
Overview
Main Body Paragraph 1
Main Body Paragraph 2
|
Question
Report Plan
- Paraphrase: shows>illustrates; figures of imprisonments>the number of prisoners
- Overview: The bar chart illustrates the number of prisoners in five varying countries, during the period of 50 years.
- Paragraph 2: (1) compare the number throughout the period in different countries. Give figures.
- Paragraph 3: (1) compare the number throughout the period in the remaining different countries. Give figures.
IELTS Band 9 Sample Answer - The Number of Prisoners in Five Varying Countries
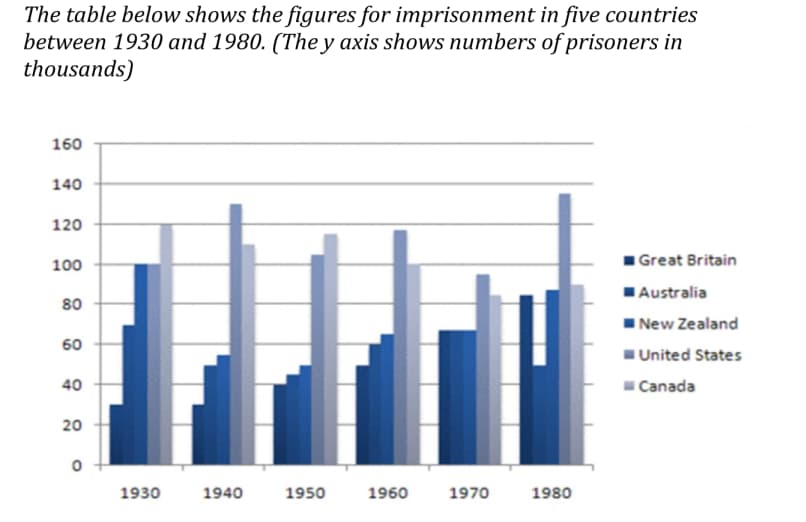
The bar chart illustrates the number of prisoners in five varying countries, namely Great Britain, Australia, New Zealand, United States and Canada, during the period of 50 years, embarking from 1930. The overview gives an impression that the rate of imprisonment in the USA and UK escalated while the number decreased in Canada, Australia and New Zealand.
As it is evident, Great Britain had the lowest number throughout the first 40 years until 1980. It is noteworthy that this country witnessed a consistent growth, which commenced from nearly 30000 in 1930 and reached around 700000 in 1970. In contrast, the US had the highest number of criminals throughout the years, except the first decade. Also, in 1980, the US had the highest number of imprisoners, which accounted for nearly 130000.
It is noticeable from the graph that the crime rate in Canada gradually and steadily decreased from 1930 to 1980, with the number as 120000 people in the former year and 90000 in the latter. Also, except for 1930 and 1980, Australia had significantly less number of prisoners. Seemingly, New Zealand always stood at the third position, while Canada and the US remained ahead of it.
Tricks to Write a Band 9 IELTS Bar Chart Answer
The following tricks will help you with all of your confusions related to answering an IELTS Bar chart answer!
- Begin your answer with a clear and well-balanced overview that talks about the major trends, patterns, or differences visible in the given bar chart without picking out specific numbers.
- Try grouping similar data together to show patterns and then organize all the information logically instead of just describing each bar separately. Because, this act can make your writing sound more mechanical.
- Making meaningful comparisons just between two different categories to showcase your analytical skills, is advised. This is because showing comparisons are important for achieving a higher band score.
- Using a wide range of words to describe quantities, changes, and trends is also essential, as your writing would show lexical variety and avoid consistent repetition.
- Avoiding personal opinions and maintaining an objective tone throughout the report will show the examiner that you only focused on what the bar chart holds. Also, do not make any assumptions based on the given data.
- Try to keep your response concise and precise, within 150 to 170 words, in order to ensure clarity when you can still meet the minimum word limit of 150 within the given time.
- Following a simple yet proper structure with a paraphrased introduction, a direct overview, and two organized body paragraphs that present your observations effectively.
- Paraphrasing the question statement using accurate synonyms and changes in sentence structure to show language flexibility right from the beginning.
- Always make sure to mention units such as years, percentages, numbers, or specifications correctly. But, missing or misinterpreting the given units can lower your task achievement criteria’s band score.
In conclusion, an IELTS Writing Task 1 Bar chart remains as one of the most effective and accessible question types for making comparisons across categories. A Bar chart’s strength lies in its simplicity because the candidates can quickly find out the differences in height or length without involving any complex decoding. Whether one is analyzing survey responses, a work performance, rise or fall in something, or any kind of data, a bar chart offers real clarity. So, keep practicing more to enhance your IELTS band score day by day!
Also check:
Practice IELTS Writing Task 1 based on report types

Start Preparing for IELTS: Get Your 10-Day Study Plan Today!

Recent Articles

Nehasri Ravishenbagam


Nehasri Ravishenbagam

Kasturika Samanta


Post your Comments