IELTS Writing Task 1 Test On 28th July With Band 8.0-9.0 Sample
Table of Contents

Try AI Essay Checker for Instant Band Score
Describe Image is one of the most complicated tasks in the IELTS Writing module. Without a sound plan, it can be difficult to perform well on the Describe Image exercise. The Bar Graph is the ideal format for practising the Describe Image problem because it has logically and simply organised all of the components. Elements of the Bar Graph include the layout, the figures, the contrasts, and the similarities.
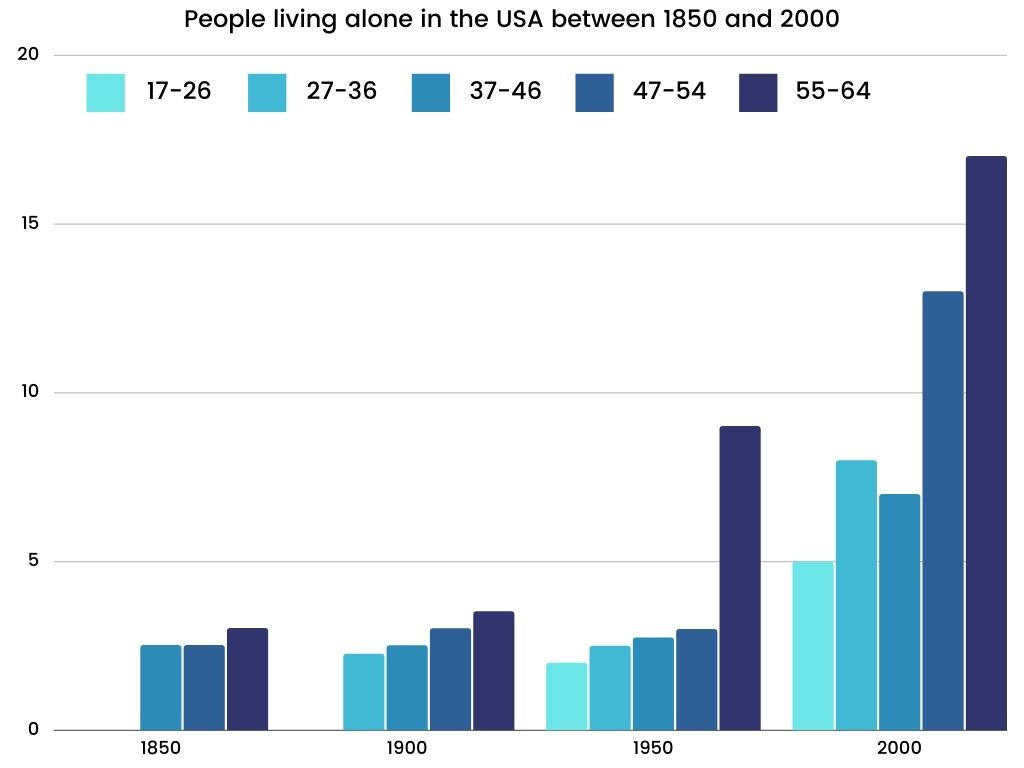
The bar chart below shows the percentage of people living alone in 5 different age groups in the USA between 1850 and 2000.

Report Plan
Paraphrase paragraph: shows>compares percentage>proportion of people in the USA>US citizens; between…and…>from….to…..; different>various
Overview/summary paragraph: (1) % increased in all age groups over this period (2) the highest percentage in the 55-64 age group
Paragraph 3: compare the percentages in 1850 and 1900, give some supporting figures
Paragraph 4: 1950: the percentages rise according to age group. (Give no figures). 2000: compare final figures for each age group (give all figures).
Sample Answer
The bar chart represents the proportion of USA citizens living alone in different age groups over one and a half centuries from 1850.
We can observe from the graph that a large number of people from different age groups decided to live alone, especially the people of 55-64 age groups. Furthermore, the figures for all age groups gradually increased over the period.
In 1850, nearly 3% of Americans aged between 55-64 lived alone, followed by 2% of people from 37-46 and 47-54 age groups. However, in 1900, there was a slight increase in the figures of people aged between 47-54 and 37-46. Interestingly, only about 4% of the people aged between 55-64 and 2% of Americans aged between 17-26 started living alone in this period.
In the first 50 years, the increase was minimal, with percentages below 4% for all the age groups. But after 1950, there was a rapid change in the pattern of those living alone. Besides, there was an upward trend in the Americans in the age groups of 37-46, 47-54, and 55-64 with moderate increase to above 7%, 13% and 17% respectively. The Americans aged between 27-36 and 17-26 didn’t start living alone until 1900, but their figures rose from 2% to 5% and 8% in the year 2000.
Get evaluated for FREE!
Got a quick report in your mind for this question. Don’t hesitate to post the same in our comment section. We will evaluate the report/letter and email you the band score & our trainer’s comments. And, this service is entirely free.
Also check :
Practice IELTS Writing Task 1 based on report types

Start Preparing for IELTS: Get Your 10-Day Study Plan Today!
Recent Articles

Nehasri Ravishenbagam

Nehasri Ravishenbagam

Kasturika Samanta


Post your Comments