IELTS Academic Writing Task 1: Social and economic indicators for four countries – Table

Table of Contents

Try AI Essay Checker for Instant Band Score
Summarise the information by selecting and reporting the main features, and make comparisons where relevant.
Write at least 150 words.
Report Plan
Paraphrase: shows>compares; social and economic indicators for four countries >socio-economic pointers
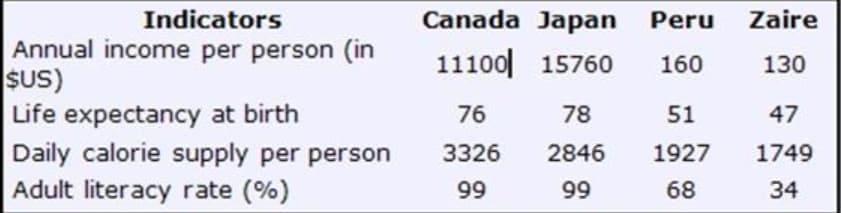
Overview: The available table compares UN data on socio-economic pointers in 1994 for four countries, namely Japan, Canada, Peru, and Zaire.
Paragraph 2: (1) Talk about the highest and the lowest indicators.
Paragraph 3: (1) Talk about different indicators of the given countries. Give figures.
Paragraph 4: (1) Talk about different indicators of the given countries. Give figures.
Sample Answer
The available table compares UN data on socio-economic pointers in 1994 for four countries, namely Japan, Canada, Peru, and Zaire.
At a glance, it is evident that the statistics for all four indicators were steadily higher in Canada and Japan. Additionally, Zaire had the least number for each of the indicators.
[do_widget id=custom_html-47]
The annual income per person in Japan was $15760, considerably ahead of Canada with $11100. There was a dramatic gap between Peru and Zaire, where the annual income per person was $160 and $130 respectively. In terms of life expectancy, this was similar in Japan (78 years) and Canada (76 years), but it was much lower in Peru (51 years) and just 47 years in Zaire.
Canada headed the table for daily calorie supply per person. Its calorie intake of 3326 is way higher than the 2846 in Japan, 1927 in Peru, and 1749 in Zaire. While the adult literacy rate was almost 100% in Canada and Japan, only 68% of people in Peru and 34% of those in Zaire were literate.
Get evaluated for FREE!
Got a quick report in your mind for this question. Don’t hesitate to post the same in our comment section. We will evaluate the report/letter and email you the band score & our trainer’s comments. And, this service is entirely free.
See also:
Practice IELTS Writing Task 1 based on report types

Start Preparing for IELTS: Get Your 10-Day Study Plan Today!

Recent Articles

Nehasri Ravishenbagam


Nehasri Ravishenbagam

Kasturika Samanta


Post your Comments
2 Comments