IELTS Academic Writing Task 1 Topic : Oil production capacity – Bar graph
2 min read
Updated On
-
Copy link
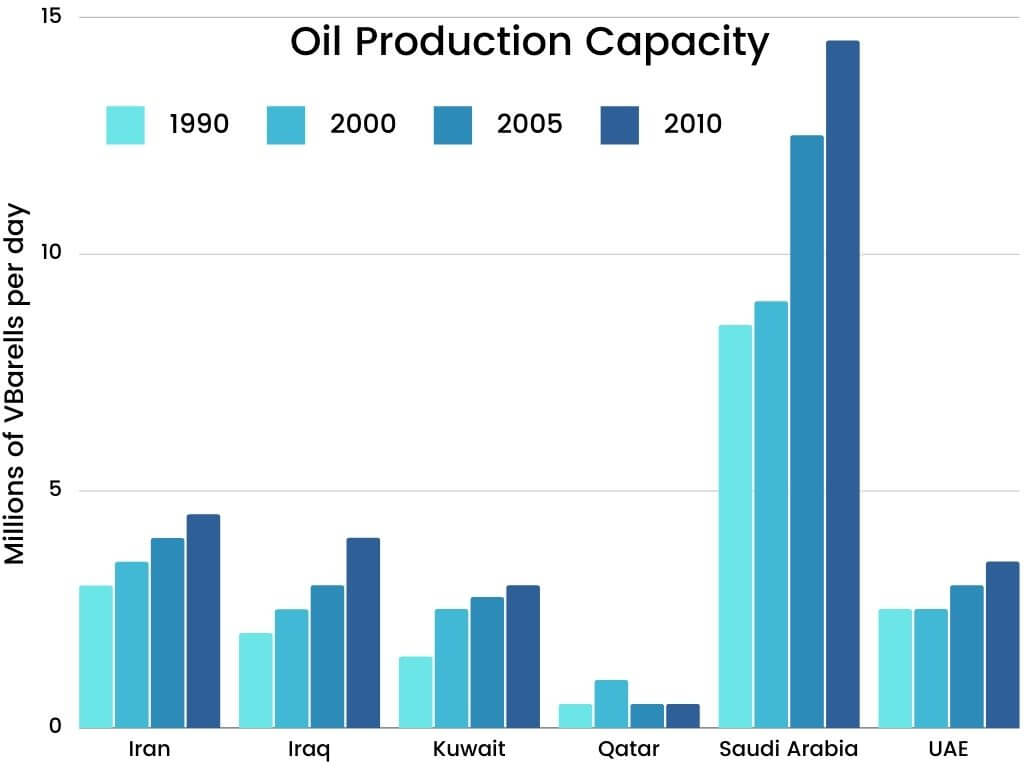
Here is the representation of the bar graph portraying possible oil production capabilities of six Gulf countries from 1990 to 2010

Table of Contents

Try AI Essay Checker for Instant Band Score
Oil production capacity
Summarise the information by selecting and reporting the main features, and make comparisons where relevant.
Write at least 150 words.
[do_widget id=custom_html-47]
Report Plan
Paraphrase: make comparisons>compares
Overview: The graph compares possible oil production capabilities of six Gulf countries from 1990 to 2010.
Paragraph 2: (1) compare the figures of the countries throughout the period. Give figures.
Paragraph 3: (1) compare the figures of the remaining countries throughout the period. Give figures.
Paragraph 4: (1) compare the figures of the countries throughout the period. Give figures. Conclude the given topic.
Sample Answer
The graph compares possible oil production capabilities of six Gulf countries from 1990 to 2010. All in all, Saudi Arabia seems to be the leading oil generating nation as the production levels escalated quicker than the other countries.
As per the presentation, the approximate oil producing capacity of Iran in 1990 was nearly 3 million barrels a day. After a decade and a half, this capacity reached 4 million a day. Finally, in 2010, the production improved slightly. In comparison to Iran, the oil generating capability of Iraq looks lower as the stock was roughly 2 million barrels a day in 1990. However, in 2010, the number almost doubled. On the contrary, Kuwait produced less than 2 million barrels a day and the production amount stood at 3.5 million in the year 2010.
Also, throughout the decade, Qatar produced the lowest amount of oil, accounted for nearly 0.5 million barrels a day. After two decades, the production level remained consistent at the same level. Also, in the United Arab Emirates, the generation showed a similar pattern as compared to Iraq and the production reached nearly 4 million barrels in 2010.
Lastly, the oil generating levels of Saudi Arabia seemed to be the highest than other nations. In 1990, it produced more than 8 million barrels a day, which turned out to be approximately four times more than other nations. The daily production also soared to more than 14 million barrels and this was slightly the same as the cumulative oil production of other nations.
Get evaluated for FREE!
Got a quick report in your mind for this question. Don’t hesitate to post the same in our comment section. We will evaluate the report/letter and email you the band score & our trainer’s comments. And, this service is entirely free.
See also:
Practice IELTS Writing Task 1 based on report types

Start Preparing for IELTS: Get Your 10-Day Study Plan Today!

Recent Articles

Nehasri Ravishenbagam


Nehasri Ravishenbagam

Kasturika Samanta


Post your Comments
3 Comments