IELTS Writing Task 1 Actual Test 47 - Topic: Total Oil Use of 4 Main Consumers
Get ready to check out a Band 9 sample answer for the IELTS Writing Task 1 line graph on the ‘Total Oil Use of 4 Main Consumers’ along with a complete and clear structure breakdown here!
Table of Contents

Try AI Essay Checker for Instant Band Score
In the IELTS Writing Task 1 of the Academic section, there will be a visual representation or a diagram on which you have to write a paragraph. One of these visual representations may be pie charts. The IELTS line graph shows how data changes over time.
These line graphs will have 2 axes, one is X-axis and another is Y-axis. While the X-axis shows the time period and the Y-axis shows what is being measured. The line graph highlights the trends when the data goes up and down. You should take only 20 minutes to complete this task and it should be a 150-word report.
Let’s now have a look at the IELTS Writing Task 1 Line Graph - ‘total oil use of 4 main consumers from 2009 to 2030’ – with a band 9 expert-curated sample answer!
Structure Breakdown for the IELTS Line Graph
|
Question Type
Introduction
Overview
Main Body Paragraph 1
Main Body Paragraph 2
|
Question
You should spend no more than 40 minutes on this task.
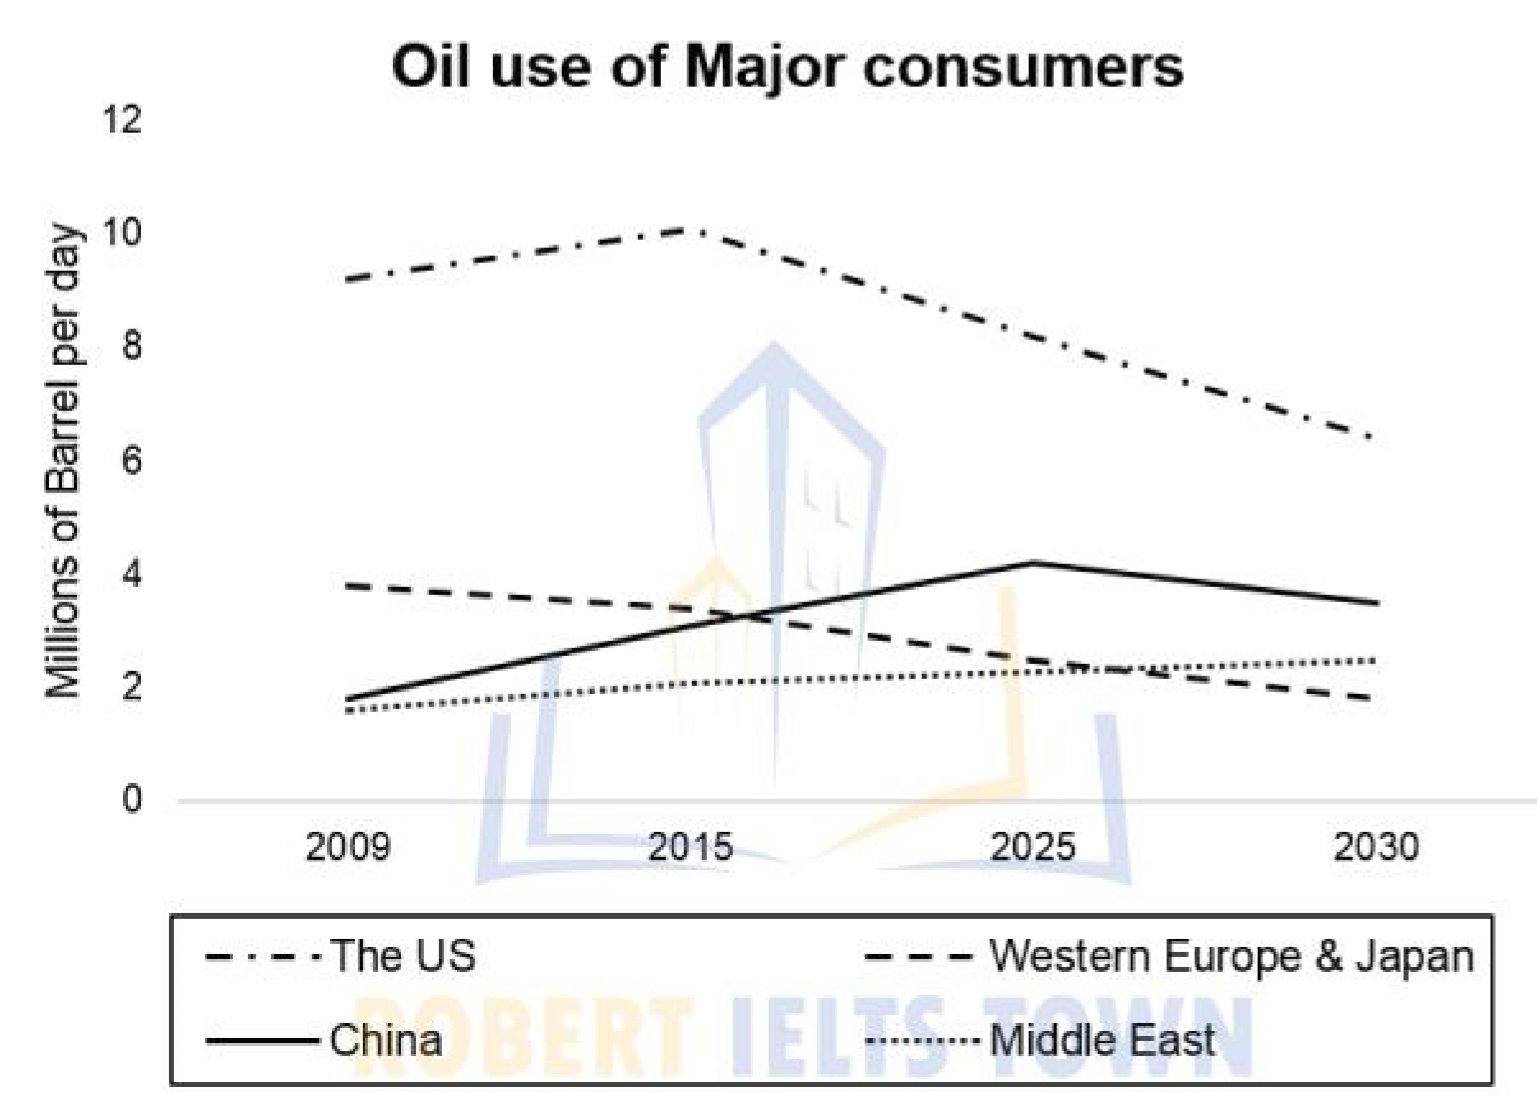
The graph below gives information about total oil use of 4 main consumers from 2009 to 2030.
Summarize the information by selecting and reporting the main features, and make comparisons wherever relevant.
You should write at least 250 words.

IELTS Writing Task 1 Line Graph
The given line chart illustrates the daily amount of oil consumed by four regions between 2009 and 2030.
It is obvious that the oil consumption of China and Middle East increased slightly while that of the US and Western Europe & Japan declined considerably during the period shown.
In 2009, the amount of oil used by the US was the biggest with just over 9 million barrels per day, followed by that of Western Europe & Japan with approximately 4 million. In the same year, China and Middle East only burned some 2 million per day. In 2015, even though the US’s oil consumption reached a peak at around 10 million barrels, it is expected that this figure will decrease significantly to just over 6 million barrels in 2030
In addition, before falling to about 3.5 million in 2030, the number of oil barrels consumed in China will double in 2025, which makes this country become the second biggest oil consumer. At the end of the period shown, the daily numbers of barrels used by Western Europe & Japan and Middle East are projected to be around 2 million.
Ready to improve your IELTS Writing game with our best experts? Book a FREE Demo!
Top 6 Tricks to Crack IELTS Writing Task 1 Line Graphs
- While you write the introduction part, you can paraphrase the question asked or the topic of the essay.
- As you explain the overall trend, identify the main feature and explain it.
- Make sure that each paragraph has examples that are percentages or numbers to support the sentence written as an explanation.
- Take a look into the various lessons available on the line graph in order to answer the complex questions.
- One last tip is to practice as much as possible so that you get a good hold on what to write in the examination when questions become complex.
- Here, you may also need to use appropriate IELTS Writing Task 1 line graph vocabulary like suitable verbs, nouns, adverbs, adjectives, prepositions related to time.
10 Examples for the IELTS Writing Task 1 Line Graph
- Example 1
- Example 2
- Example 3
- Example 4
- Example 5
- Example 6
- Example 7
- Example 8
- Example 9
- Example 10
Approaching the IELTS Writing exam without practicing is a waste because you will not be able to understand anything in the exam. It may become complex and test-takers may skip the question which in turn will reduce your IELTS band score.
Remember to proofread your essay for grammar, vocabulary, and spelling errors. These tips, combined with practice, will help you write well-structured and coherent IELTS Writing Task 1 Line graph answers like this one!
Also check :
Explore IELTS Writing

Start Preparing for IELTS: Get Your 10-Day Study Plan Today!
Recent Articles
Haniya Yashfeen

Kasturika Samanta


Post your Comments