Carbon Emissions in Different Countries – IELTS Writing Task 1
5 min read
Updated On
-
Copy link
This blog explores 3 sample IELTS Writing Task 1 answers on IELTS Bar Charts ‘Carbon Emissions in Different Countries’ to improve your IELTS writing task 1 academic and boost your band score!
Table of Contents
- Question
- Structure Breakdown
- Carbon Emissions in Different Countries - Sample Answer 1
- Carbon Emissions in Different Countries - Sample Answer 2
- Carbon Emissions in Different Countries - Sample Answer 3
- Tips to Ace IELTS Writing Task 1 Bar Chart - Carbon Emissions in Different Countries
- Carbon Emissions in Different Countries - Connectors Used

Try AI Essay Checker for Instant Band Score
In the Academic IELTS Writing Task 1, you may be asked to describe a visual like the bar chart titled "Carbon Emissions in Different Countries" by writing a factual report.
The IELTS Bar charts, also known as bar graphs, are a common question type. They present data using rectangular bars—either vertical or horizontal—across two axes, often illustrating comparisons, trends, or changes over time. This type of task assesses your ability to summarise key features, make comparisons, and highlight significant trends.
Below, you'll find a IELTS Writing Task 1 bar chart on carbon emissions along with three expert sample answers demonstrating how to approach this task for Band 7, Band 8, and Band 9 performance levels.
Question
The bar graph below shows the amount of carbon emissions in different countries during three different years.
Summarize the information by selecting and reporting the main features, and make comparisons wherever relevant.
Write at least 150 words.
Structure Breakdown
Question Type
Introduction
Overview
Main Body Paragraph 1
Main Body Paragraph 2
|
Want to boost your Writing Task 1 score? Get our Academic Book now!
Carbon Emissions in Different Countries - Sample Answer 1
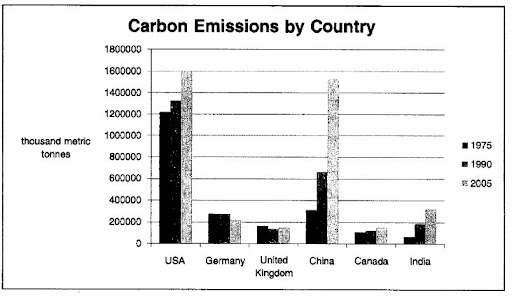
The bar graph shows CO2 emissions for six countries in 1975, 1990, and 2005. Overall it is evident that the two largest contributors to carbon emissions were the USA and China.
Firstly, the USA emitted the largest amount of carbon for all three years, showing an increase from slightly over 1,200,000 thousand metric tonnes in 1975 to just under 1,600,000 thousand metric tonnes in 2005. China’s level of carbon emissions more than doubled from 300.000 thousand metric tonnes in 1975 to over 600,000 thousand metric tonnes in 1990 before more than doubling again to approximately 1.6 million thousand metric tonnes in 2005.
In contrast, Germany’s carbon emissions reduced slightly from approximately 250,000 in 1975 and 1990 to roughly 200,000 in 2005. The only other country to reduce emissions was the United Kingdom between 1975 (approximately 180,000) and 1990 (about 160,000), although this was relatively slight and rose again in 2005 to 170,000.
(164 Words)
Book a FREE demo to talk to our experts and boost your prep for IELTS Writing now!
Carbon Emissions in Different Countries - Sample Answer 2
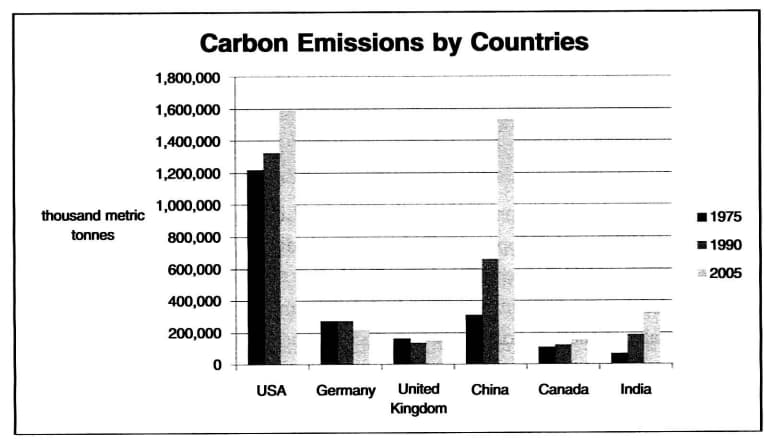
The provided bar chart gives data on carbon emission trends in seven countries in 1975, 1990, and 2005.
Overall, while the USA and China saw upward trends in emissions, the other countries remained steady. To mention, Canada and the UK showed the lowest emission rates throughout the mentioned years.
Regarding the country of the United States, they witnessed a drastic increase from around 1.2 million metric tonnes in 1975 to 1.6 million by 2005, standing at the top. Similarly, China experienced a rapid rise from about 300000 metric tonnes to 15000000 within the same period of 1975 and 2005.
In contrast to this, Germany and India maintained relatively stable carbon emission levels. Both the countries clearly never crossed over 300000 tonnes throughout the mentioned years. Regarding the UK and Canada, their carbon emissions didn’t change much and stayed around less than 200000 metric tonnes from 1975 to 2005. To mention, Canada’s level increased each year slightly to match the UK in 2005, and carbon emissions in India jumped from approximately 80.000 in 1975 to 350,000 in 2005.
(181 Words)
Carbon Emissions in Different Countries - Sample Answer 3
The given bar chart illustrates the carbon emissions of six countries in the years 1975, 1990, and 2005, measured in thousand metric tonnes.
Overall, Germany and the UK saw reductions in their carbon emissions, whereas the USA, China, Canada, and India experienced a hike in the mentioned years. Notably, the USA consistently showed the highest amount each year.
Regarding 1975, the USA had the highest emissions, surpassing 120,000 thousand metric tonnes, peaking at around 160,000 in 2005; which is a significant increase. Then, China also saw a sharp rise, from about 60,000 in 1975 to 150,000 in 2005, nearly tripling its emissions.
In contrast, India had the lowest emissions, around 30,000 by the final year, 2005. Considering Germany’s emissions, they remained stable at 210,000 in 1975 and 1990 but decreased slightly by 10,000 in 2005. Whereas the UK experienced a minor decrease throughout the years unlike Canada, which showed an increase during the same period.
(162 Words)
Boost your IELTS Writing score with expert guidance—join our online webinar now!
Tips to Ace IELTS Writing Task 1 Bar Chart - Carbon Emissions in Different Countries
The following are some tips to Ace IELTS Writing Task 1 Bar Chart - Carbon Emissions in Different Countries
- Identify Key Trends: Focus on the highest, lowest, and most noticeable changes for your overview.
- Group and Compare Data: Avoid listing. Compare and group similar data to show meaningful patterns.
- Use Varied Vocabulary: Replace common words like “increase” with synonyms like climb, rise, surge, plummet, or dip.
- Be Accurate with Figures & Tense: Use correct tenses and describe values precisely using percentages, comparisons, or approximate figures.
- Follow a Clear Structure: Write four paragraphs—Introduction, Overview, and two Body paragraphs—for clarity and coherence.
Got any essays on IELTS Writing Task 1 topic, Get Evaluated for FREE!
Carbon Emissions in Different Countries - Connectors Used
Connectors, also known as connectives or transition words, are words or phrases that link ideas or parts of a sentence or paragraph together. Here are some of the connectors used in the above sample answers:
- Firstly
- Overall it is evident that
- In contrast
- Regarding
- Similarly
- Considering
- To mention
- Then
- Whereas
- Overall
Boost your score—practice with Recent IELTS Writing Task 1 Topics Academic with Model Answers!
Finally, make sure to proofread your IELTS Writing Task 1 essay for grammar, vocabulary, and spelling. With consistent practice and these tips, you'll craft clear and well-structured answers for IELTS Writing Task 1 line graphs like ‘Carbon Emissions in Different Countries’ and achieve your targeted band score.
Useful Links:
- Percentage of People Living Alone in 5 Different Age Groups in the USA - IELTS Academic Writing Task 1 (Bar Chart)
- IELTS Academic Writing Task 1 Topic 43: Number of overseas students enrolled - Bar chart
- IELTS Academic Writing Task 1 Topic 06: Global population percentages and distribution of wealth - Bar Chart
- Vocabulary for Accurate Data in Writing Task 1
- Coherence and Cohesion in IELTS Writing
- Cohesive Devices in IELTS Writing: Meaning, Examples & List
Explore IELTS Writing

Start Preparing for IELTS: Get Your 10-Day Study Plan Today!

Recent Articles
Haniya Yashfeen


Kasturika Samanta


Post your Comments
1 Comment