Percentage of People Living Alone in 5 Different Age Groups in the USA - IELTS Academic Writing Task 1 (Bar Chart)
Learn how to summarize and compare data, highlight major changes, and use precise language to craft a high-scoring response for IELTS Writing Task 1 bar graph with the topic, ‘Percentage of People Living Alone in 5 Different Age Groups in the USA’ here.

Table of Contents
- Question for Percentage of People Living Alone in 5 Different Age Groups in the USA - IELTS Writing Task 1
- Outline to Frame Your Answer for IELTS Bar Graph
- Sample Answers for Percentage of People Living Alone in 5 Different Age Groups in the USA - IELTS Writing Task 1
- How to Answer Percentage of People Living Alone in 5 Different Age Groups in the USA IELTS Writing Task 1?

Try AI Essay Checker for Instant Band Score
An IELTS bar graph in the Academic Writing Task 1 displays information in rectangular bars, making it easier to compare different groups or categories. So, practising bar graph topics, like ‘Percentage of People Living Alone in 5 Different Age Groups in the USA’ is essential. It requires you to analyze how the proportion of individuals living solo varies across age brackets.
In this blog, we will explore 3 sample answers, along with useful tips and vocabulary to describe a graph or chart topic, Percentage of People Living Alone in 5 Different Age Groups in the USA, for a high-scoring response.
Question for Percentage of People Living Alone in 5 Different Age Groups in the USA - IELTS Writing Task 1
You should spend about 20 minutes on this task.
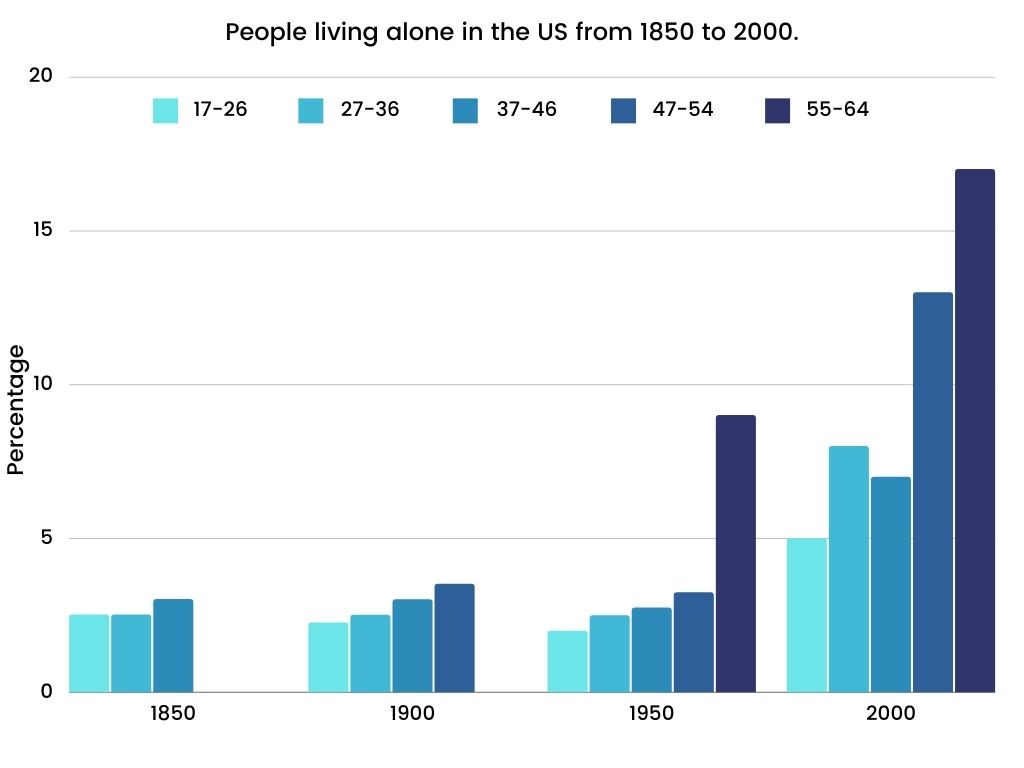
The bar chart below shows the percentage of people living alone in 5 different age groups in the US from 1850 to 2000. Summarise the information by selecting and reporting the main features, and make comparisons where relevant.
Write at least 150 words.
Outline to Frame Your Answer for IELTS Bar Graph
|
Introduction (Paraphrase the Question)
Overview (Summary of Main Trends)
Body Paragraph 1 (First Half of the Data – e.g., Younger Age Groups)
Body Paragraph 2 (Second Half of the Data – e.g., Older Age Groups)
Conclusion
|
Sample Answers for Percentage of People Living Alone in 5 Different Age Groups in the USA - IELTS Writing Task 1
Below are three IELTS Writing Task 1 sample answers on the topic, Percentage of People Living Alone in 5 Different Age Groups in the USA, that will help you write an answer for a band score 9.
Percentage of People Living Alone in 5 Different Age Groups in the USA - Sample Answer 1
The chart compares the proportion of US citizens living alone from 1850 to 2000 in terms of various age groups.
Overall, it is clear that the percentage of the US population living alone increased over the period in all age groups. The highest proportion of those who lived alone was among the 55-64 year-olds.
In 1850, figures for three age groups are given. Just over 2% of those aged 37-46 and those aged 47-54 lived alone, slightly less than 3% for the 55-64 age group. In 1900 the proportion of those living alone in the 37-46 category remained stable, but there were small increases in the figures for the 47–54 and 55-64 year-olds, compared with only 2% of those aged 17-26.
A new pattern emerged in 1950, with the percentage of those living alone increasing according to age. The year 2000 then saw a rise in the proportions of people living alone, with the percentage of the 55 -64 year-olds almost doubling to 17%, ahead of the 47-54 and 27-36 age groups with 13% and 8% respectively. While 5% of the 17-26 group lived alone, the figure was higher among the 37-46 year-olds at 7%.
Boost your IELTS Writing score with expert guidance—join our online webinar now!
Percentage of People Living Alone in 5 Different Age Groups in the USA - Sample Answer 2
The bar chart represents the proportion of USA citizens living alone in different age groups over one and a half centuries from 1850.
We can observe from the graph that a large number of people from different age groups decided to live alone, especially the people of 55-64 age groups. Furthermore, the figures for all age groups gradually increased over the period.
In 1850, nearly 3% of Americans aged between 55-64 lived alone, followed by 2% of people from 37-46 and 47-54 age groups. However, in 1900, there was a slight increase in the figures of people aged between 47-54 and 37-46. Interestingly, only about 4% of the people aged between 55-64 and 2% of Americans aged between 17-26 started living alone in this period.
In the first 50 years, the increase was minimal, with percentages below 4% for all the age groups. But after 1950, there was a rapid change in the pattern of those living alone. Besides, there was an upward trend in the Americans in the age groups of 37-46, 47-54, and 55-64 with moderate increase to above 7%, 13% and 17% respectively. The Americans aged between 27-36 and 17-26 didn’t start living alone until 1900, but their figures rose from 2% to 5% and 8% in the year 2000.
Grab Our Extensive Bundle for IELTS Writing (Academic) & Ease Your Writing Worries!
Percentage of People Living Alone in 5 Different Age Groups in the USA - Sample Answer 3
The bar graph illustrates the proportion of individuals living alone in the United States across five distinct age groups in the years 2000 and 2020.
Overall, the percentage of people living alone increased in most age categories over the 20-year period, with the highest rise seen among those aged 75 and above. In contrast, the percentage remained relatively low and stable among the younger age groups.
In detail, in 2000, approximately 5% of individuals aged 18–24 lived alone, and this figure remained unchanged in 2020. The 25–34 age group saw a slight increase, from around 8% to just above 10%. A more notable rise was observed in the 35–49 bracket, growing from nearly 10% to 12%.
In the older age ranges, the increases were more substantial. The 50–64 age group experienced an increase from roughly 14% in 2000 to 19% in 2020. Most significantly, the percentage of people aged 75 and above living alone rose sharply from 20% to nearly 27%, making it the highest among all groups in both years.
To sum up, these figures suggest a growing trend of solitary living, particularly among the elderly population in the USA.
How to Answer Percentage of People Living Alone in 5 Different Age Groups in the USA IELTS Writing Task 1?
To effectively tackle this bar graph tasks, like Percentage of People Living Alone in 5 Different Age Groups in the USA, you need a solid strategy. Below are five focused top writing techniques for the IELTS Writing section on how to answer this task effectively and they will help you craft a high-scoring response.
- Group Similar Age Trends Together: Rather than describing each age group in isolation, look for patterns and similarities to combine them logically. This will show the examiners that you can organize data meaningfully and compare trends effectively.
- Use Appropriate Percentage Vocabulary: Using accurate terms and relevant IELTS vocabulary, like ‘approximately’, ‘just under,’ ‘about,’ or ‘nearly doubled’ helps you express numerical information precisely. Avoid overusing exact figures.
- Highlight the Most and Least Significant Changes: Your overview and body should point out key differences, such as the largest increase (e.g., 75+ age group) or any unchanged categories (e.g., 18–24). Doing this shows you can spot important features in the data.
- Maintain a Formal, Objective Tone: Task 1 is a factual report, not a personal opinion piece. Avoid speculating on why people lived alone or how society might change. Use neutral, academic language, and focus solely on what the bar graph presents. Maintaining this tone is critical for achieving a high band in Task Achievement and Coherence.
- Structure Your Response Logically: Follow a consistent structure: introduction, overview, followed by body paragraphs with grouped comparisons. Each paragraph should flow logically into the next. A well-organized answer helps the reader (examiner) follow your ideas clearly, which directly contributes to your Coherence and Cohesion score.
To sum up, mastering the IELTS bar graph tasks like ‘Percentage of People Living Alone in 5 Different Age Groups in the USA’ requires regular practice with varied recent IELTS Writing Task 1 topics academic with model answers. It helps improve speed, accuracy, and fluency. Also, focus on structuring your response well and using precise vocabulary, and you'll be well on your way to achieving a high band score.
Useful Links:
- Annual Pay for Doctors and Other Workers - IELTS Academic Writing Task 1 Bar Chart
- IELTS Academic Writing Task 1 Topic 22: Railway system in six cities in Europe – Bar Chart
- Division of Household Tasks by Gender in Great Britain- Bar Graph
- IELTS Academic Writing Task 1 Topic : People affected by four types of noise pollution - Bar graph
- Recent IELTS Academic Writing Test (Task 1 & 2) with Sample Answers
- Coherence and Cohesion in IELTS Writing
- Cohesive Devices in IELTS Writing: Meaning, Examples & List
Practice IELTS Writing Task 1 based on report types

Start Preparing for IELTS: Get Your 10-Day Study Plan Today!

Explore other Writing Task 1 Articles

Kasturika Samanta


Nehasri Ravishenbagam
Recent Articles

Nehasri Ravishenbagam


Nehasri Ravishenbagam

Kasturika Samanta


Post your Comments