Main Methods of Transportation for People Travelling to a University - IELTS Pie Chart
Get ready to practice the Main Methods of Transportation for People Traveling to a University - IELTS Pie Chart now! Read our expert-written band 9 sample answer along with the suitable vocabulary as well!
Table of Contents

Try AI Essay Checker for Instant Band Score
In IELTS Writing Task 1 of the academic section, there will be a visual representation like ‘Main Methods of Transportation for People Travelling to a University,’ to which you have to write a report about!
An IELTS pie chart is a graphical/pictorial illustration of a cycle or a sequence of events that occur in a process. To describe a pie chart, you are expected to observe it and explain the sequence provided in it. You are scored based on your comprehension of the process chart, the way you explain it, the aptness of the vocabulary, and the construction of the sentences with good grammatical usage.
Let’s now have a look at the IELTS Pie chart - ‘Main Methods of Transportation for People Travelling to a University’ - with an expert-curated IELTS band score 9 sample answer now!
Question
You should spend 20 minutes on this task.
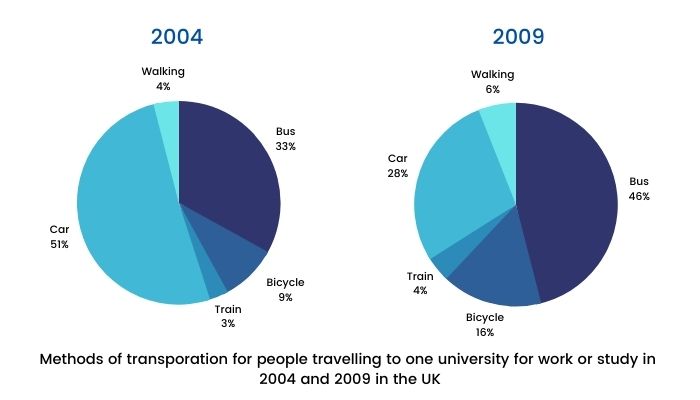
The charts below show the main methods of transportation for people traveling to a university for work or study in 2004 and 2009.
Summarise the information by selecting and reporting the main features and make comparisons wherever relevant.
You should write at least 150 words.
Report Plan
|
Paraphrase: It depicts transportation modes used by people to travel to university for work or study purposes in 2004 and 2009. Overview/Summary: 1) decrease in the proportion of car travelers from 2004 to 2009. 2) Upward trend in other modes of transportation. Paragraph 3: Give figures for Car travelers, bicyclists, and pedestrians in 2004. Paragraph 4: Introduction of the new bus stop; alterations at the car parking area. Give figures. Paragraph 5: Significant increase in the ratio of bicyclists, train passengers, and pedestrians. Give figures. |
Main Methods of Transportation for People Travelling to a University - Band 9 Sample Answer
The pie charts depict the proportion of travelers using five different modes of transportation to commute to a university for work and study purposes in 2004 and 2009.
We can observe from the pie-charts that the ratio of people commuting by cars significantly decreased from the year 2004 to 2009 while the other modes of transportation witnessed an upward trend.
Over half of the people (51%) in 2004 traveled by car followed by bus which recorded a ratio of 33%. It is apparent that only 9% of people used bicycles to commute to university which was about three times the ratio of commuters who used the train. Meanwhile, 4% of the people preferred to walk to go to the university.
The proportion of bus-based travelers rose significantly by 13% as a new bus stop was introduced at the university in 2006. Further, some modifications were made to the car parking in 2008 at the university, which led to the ratio of car travelers dwindling to 28%.
In contrast, the percentage of bicyclists witnessed a substantial rise by 7% along with the train passengers and pedestrians proportion which followed an upward trend to 4% and 6% respectively.
Note: For this IELTS Academic writing task 1, Useful Tips and Vocabulary to Describe a Graph or Chart are highlighted for you!
Clear the IELTS Academic Writing Task 1 pie charts in no time with a band 9 now!
Sign up for a FREE demo
Main Methods of Transportation for People Travelling to a University - Vocabulary
- Depict: Showing or representing something in a painting, or words.
Example: The pie chart depicts the growth of the given company over the past few years.
- Proportion: A part of a whole.
Example: A small proportion of the population prefers traditional stores over online shopping.
- Commute: To travel on a regular basis between home and workplace or even school..
Example: He commutes to his office by train daily.
- Dwindle: To gradually become lesser or smaller.
Example: The number of employees in the office dwindled as the years went by.
Get Better at Writing for IELTS with IELTSMaterial
Practising more IELTS writing practice tests, as well as different topics on pie charts, would be hugely beneficial for you! Talk to our IELTS experts if you are wondering how to succeed on the IELTS writing exam. Also, we're holding interactive webinars where you can learn tricks to ace the writing component of the IELTS test. Let us know how it helped you prepare by leaving a comment below!
Also Check:
Related Articles:
Practice IELTS Writing Task 1 based on report types

Start Preparing for IELTS: Get Your 10-Day Study Plan Today!

Recent Articles

Nehasri Ravishenbagam


Nehasri Ravishenbagam

Kasturika Samanta


Post your Comments
15 Comments