IELTS Academic Writing Task 1: Source of complaints about the bank of America
6 min read
Updated On
-
Copy link
Table of Contents

Try AI Essay Checker for Instant Band Score
Introduction
The sample answers for the IELTS Writing Task 1 on the Source of Complaints about Bank of America are given below. Candidates are encouraged to use this as a reference to formulate their own sample answers.
In the IELTS Writing Task 1 Academic module, test-takers must describe visual information, such as graphs, charts, diagrams, tables, or maps, in at least 150 words. This task assesses their ability to accurately interpret and communicate data from visual sources.
IELTS Writing Task 1: Combination Charts
The IELTS Writing Task 1 gives you a combination of two different types of graphs, such as a line graph and a bar chart, or a pie chart and a table.
In this case, you should clearly explain each graph, compare them where relevant, and provide detailed information on the main features of both graphs. You will have 20 minutes to complete this task and write a report of at least 150 words.
To improve their writing skills, candidates should practice with IELTS Writing Task 1 practice papers.
IELTS Writing Task 1 Combination Chart: Question
| You should spend about 20 minutes on this task.
The graphs indicate the source of complaints about the Bank of America and the amount of time it takes to have the complaints resolved. Summarise the information by selecting and reporting on the main features, and make comparisons where relevant. Write at least 150 words. |
Plan Your IELTS Writing Task 1 Combination Chart
Here’s a guide that will show you how to plan your IELTS Writing Task 1 Combination Charts essay effectively. By following these tips, you can ensure that your IELTS Writing task 1 essay is well-organized and coherent.
Introduction: Begin your IELTS Writing Task 1 Combination Charts by summarizing the question in your own words in one or two sentences.
Overview: Briefly summarize the key features of each graph in two to three sentences.
Body: The body will be divided into two different paragraphs.
|
Sample Answer 1
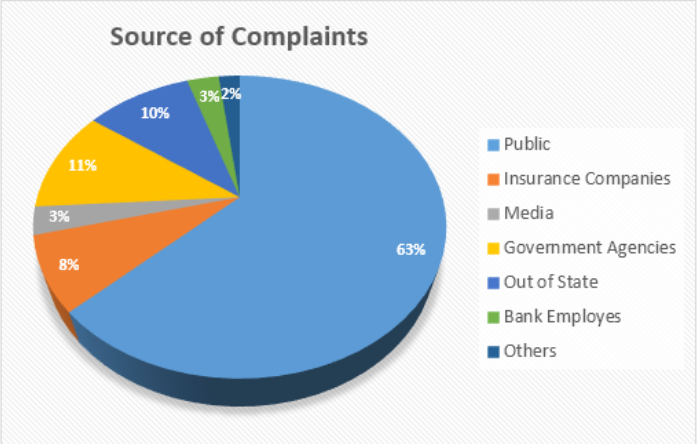
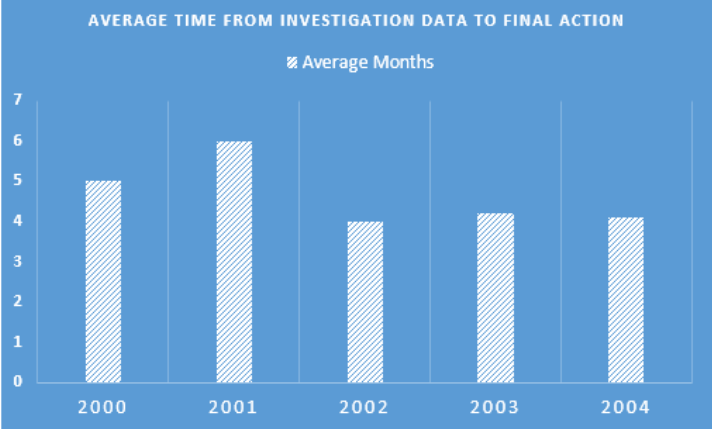
The two graphs portray dissimilar information associated with grievances within the bank of America. The pie graph displays the sources of complaints, while the bar graph demonstrates the average time taken between the inquiry into complaints and the final action taken.
At a glance, the public put forth the highest number of complaints, 63% of all, against the Bank of America. The bar graph represents that it takes an average of 5 months to take action and resolve issues. Of the remaining complaints, the figures can be divided into 11% and 8%, made up of government agencies, out-of-state agencies, and insurance companies. Interestingly, media and bank employees took up 3% of the figure in the chart.
As per the bar graph, 2001 recorded the maximum waiting time for medical misconduct complaints at 6 months. However, there is a noteworthy decline from 6 months in 2001 to 5 months in 2002, all preceding and scheduled years to display an average waiting period of 5 months.
Sample Answer 2
The pie chart illustrates the distribution of complaints by various entities concerning the Bank of America, whereas the bar graph presents the average duration needed to address these concerns. In general, the majority of complaints were voiced by the general public, while the time taken to resolve these issues ranged from 4 to 6 months.
Based on the data represented in the pie chart, the largest proportion of complaints, exceeding 60%, was lodged by the general public, closely followed by government agencies, which accounted for slightly over 11% of the total. Notably, objections from insurance companies constituted 8%, while a minimal percentage of complaints, 3% and 2% respectively, originated from the bank’s employees and external entities. Intriguingly, the media accounted for only 3% of the complaints, with the remainder originating from various other sources.
The data shown in the bar graph reveals that the Bank of America typically required around four to six months to address and resolve the mentioned complaints. Specifically, in 2001, the resolution process extended to six months, marking an increase of one month compared to previous years. Subsequently, the bank managed to reduce the resolution time to approximately 4 months in 2002, followed by a duration of 5 months in the subsequent two years to handle the submitted complaints.
Read: All Useful IELTS Writing Lessons & Websites
Band 9 Sample Answer 3
The graphs show the percentage of complaints received by Bank of America from six groups (the public, insurance companies, the media, government agencies, out-of-state entities, and bank employees), as well as the average time it takes the bank to process these complaints from start to finish.
In general, the majority of complaints originated from the general public, while the maximum duration for processing these complaints was six months in 2001, which saw a notable improvement in the subsequent year.
The pie chart clearly shows that more than 60% of complaints to Bank of America came from the public. Insurance companies accounted for 8% of complaints, while the media complained very rarely, at only 3%. Government agencies complained one in ten times, while bank employees and out-of-state complaints made up 5% of the total. Complaints from other sources, which are not included in the six categories listed, made up 10% of the total.
Taking a closer look at the bar graph, it can be observed that, in 2001, the average processing and response time for the complaints was six months. Moreover, both the years before and after 2001 showed an average waiting duration ranging between 4 to 5 months.
Band 9 Sample Answer 4
The two graphs show different information about complaints against Bank of America. The pie chart shows the sources of complaints, while the bar chart shows the average time it takes to investigate and resolve complaints. According to the bar chart, it took less than 6 months to resolve a complaint in 2000, but more than 6 months in 2001. It took about 5 months to resolve a complaint in 2002, 6 months in 2003, and 4.5 months in 2004.
At first, the public filed the most complaints against Bank of America, accounting for 63% of all complaints. According to the bar graph, it took an average of 5 months to resolve these complaints. The remaining complaints came from two categories: government agencies, out-of-state agencies, and insurance businesses, which accounted for 11% and 8% of complaints, respectively. The bar graph also shows that the maximum waiting period for medical misconduct complaints in 2001 was 6 months. However, there was a significant decrease from 2001 to 2002, with the average waiting period for all complaints in subsequent years remaining at 5 months.
Most complaints against Bank of America (63%) are filed by the general public. The remaining 37% of complaints come from a variety of sources, including government agencies (11%), out-of-state agencies (8%), and insurance companies (8%). Oddly, only 3% of complaints come from the media and bank employees.
The bar graph shows that the longest waiting time for medical malpractice complaints was 6 months in 2001. While there was a significant decrease in waiting time from 2001 to 2002, all previous and subsequent years had an average waiting time of 5 months. Nevertheless, the average waiting time is decreasing over time. Additionally, the bar graph shows that it took the longest to resolve complaints in 2001, which was a month longer than in previous years. However, the waiting time decreased to 4 months in 2002 and fluctuated around the same length in the following two years. As a result, the average waiting time to resolve complaints ranges from 4 to 5 months.
Tips for IELTS Writing Task 1 Combination Charts:
- Be concise. You only have 20 minutes for the task, so focus on reporting the most important features of each graph (two features per graph).
- Do not group data from different graphs into the same paragraph.
- Make sure to compare the two graphs in at least one paragraph. This shows that you understand the relationships between the two sets of data.
- Avoid giving personal opinions or viewpoints. The task is to report the information in the graphs objectively.
- Use linking words and phrases to connect your sentences and paragraphs. This will make your writing more coherent and easy to read.
- Use appropriate vocabulary and grammar structures for each graph.
Also Read:
Practice IELTS Writing Task 1 based on report types

Start Preparing for IELTS: Get Your 10-Day Study Plan Today!

Recent Articles

Nehasri Ravishenbagam


Nehasri Ravishenbagam

Kasturika Samanta


Post your Comments
4 Comments