IELTS Academic Writing Task 1 Topic : Newly graduated students in the UK and their proportions – Multiple Graphs
Table of Contents

Try AI Essay Checker for Instant Band Score
IELTS Writing Task 1
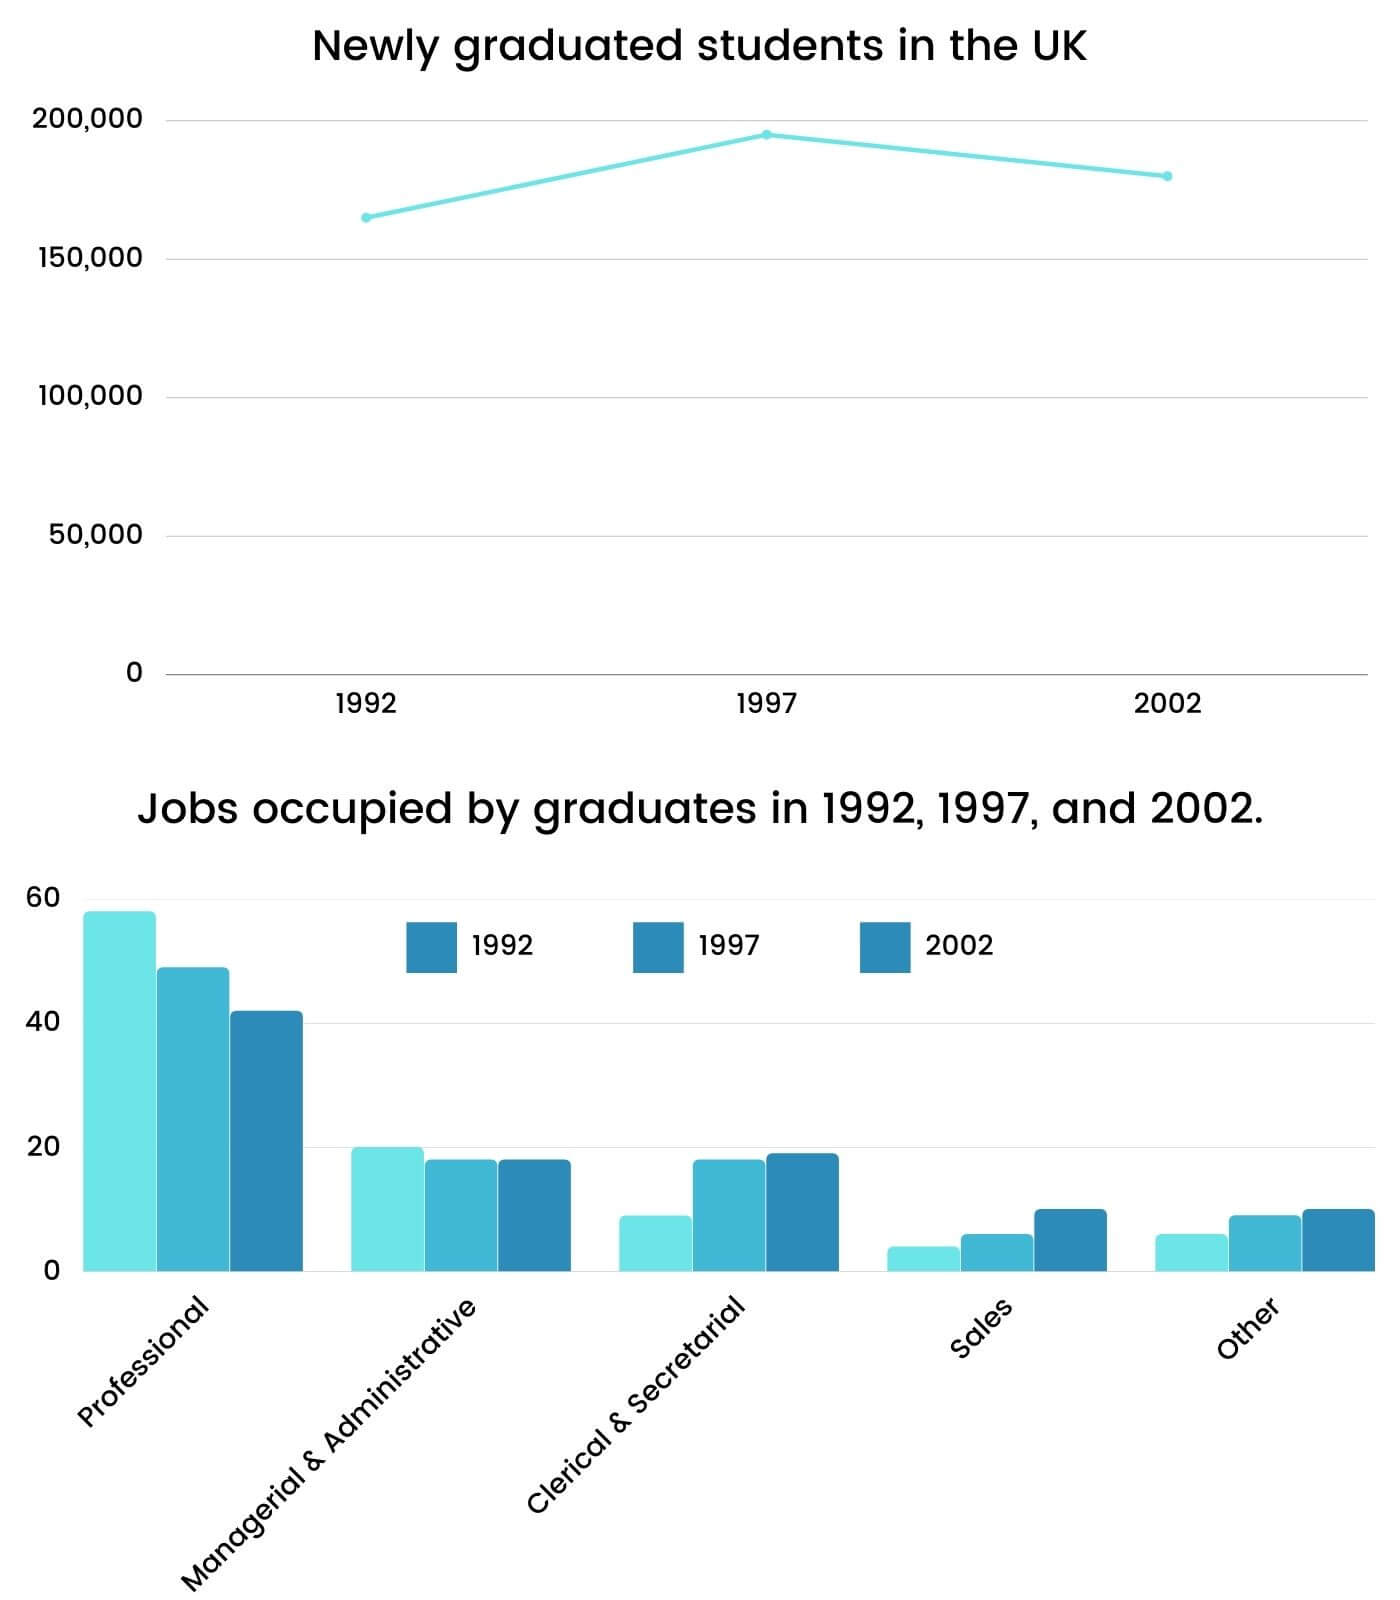
The line graph shows the number of newly graduated students in the UK, while the bar chart compares their proportions in five different jobs occupied by them in 1992, 1997, and 2002.
[do_widget id=custom_html-24]
In general, the number of fresh graduates in the UK underwent a sharp rise to a peak, followed by a less dramatic fall with an overall increasing trend. While jobs requiring professional skills were the top preference of fresh graduates, working in a sales department was least opted.
In 1992, the UK welcomed 165,000 fresh graduates. This number then increased dramatically and hit a peak of 195,000 in 1997 before falling back to 180,000 in the next five years.
[do_widget id=custom_html-47]
It can be seen from the breakdown that although the highest percentage of about 58% of fresh graduates in 1992 became professional workers, and this kind of job gradually lost its popularity with only 43% people choosing this profession in 2002. Experiencing an insignificant downward trend, the proportion of new graduates working as managers and administrators declined from well over 20% (about 33,000 graduates) to around 18% in 1997 and remained stable till 2002.
By contrast, more young adults were keen on clerical and secretarial positions, with figure doubling from nearly 9% to roughly 20% over the period. Likewise, sales and other professions also saw a rise in popularity among fresh graduating students, yet negligible, to around 10%.
Get evaluated for FREE!
Got a quick report in your mind for this question. Don’t hesitate to post the same in our comment section. We will evaluate the report/letter and email you the band score & our trainer’s comments. And, this service is entirely free.
Also check:
- IELTS Writing Task 1
- IELTS Writing Task 1 Line Graph
- IELTS Writing Task 1 Bar chart
- IELTS Writing task 1 Diagram
- IELTS Writing task 1 Map
- IELTS Writing task 1 Pie chart
- IELTS Writing task 1 Table chart
- IELTS Writing task 1 tips
- Tips to Improve IELTS Writing Skills
- IELTS Writing recent actual test
- IELTS Writing Answer sheet
- IELTS map vocabulary
- IELTS Writing Task 1 Connectors
Practice IELTS Writing Task 1 based on report types

Start Preparing for IELTS: Get Your 10-Day Study Plan Today!

Explore other Writing Task 1 Articles
Kasturika Samanta


Nehasri Ravishenbagam
Recent Articles

Nehasri Ravishenbagam


Nehasri Ravishenbagam

Kasturika Samanta


Post your Comments
5 Comments