Anthropology Graduates From One University – IELTS Writing Task 1
5 min read
Updated On
-
Copy link
Table of Contents
- Question
- Structure Breakdown
- Band 7 Sample Answer For Writing Task 1 Combination Charts – Anthropology Graduates From One University
- Band 8 Sample Answer For Writing Task 1 Combination Charts – Anthropology Graduates From One University
- Band 9 Sample Answer For Writing Task 1 Combination Charts – Anthropology Graduates From One University
- Connectors Used in the Above Sample Answers of ‘Anthropology Graduates From One University’
- Useful Links:

Try AI Essay Checker for Instant Band Score
In IELTS Writing Task 1 of the academic section, there will be a visual representation like the combination chart in the topic ‘Anthropology Graduates From One University’ on which you have to write a report.
Sometimes, you are asked to explain the combination charts in the IELTS examination. This question type in the IELTS Writing Task 1 requires you to explain more than one diagram or graph and also describe how they are similar or different.
Although it might seem tricky, it’s actually the easiest question type. One effective way to tackle this is by dedicating a separate paragraph for each diagram to explain what data you observe in it.
Let’s have a look at the given combination charts – ‘Anthropology Graduates From One University’ – with three expert-curated sample answers for different IELTS band scores ranging from band 7-9.
Question
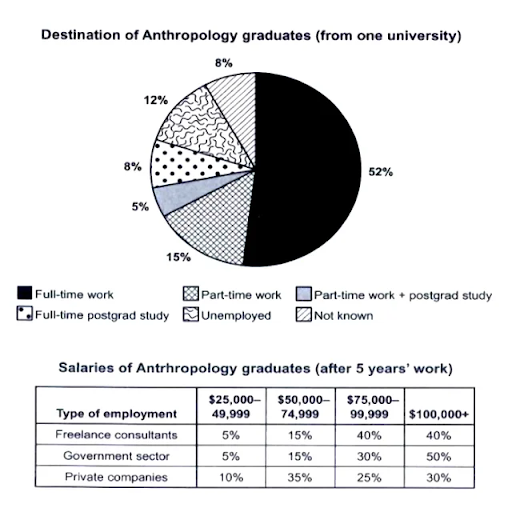
The chart below shows what Anthropology graduates from one university did after finishing their undergraduate degree course. The table shows the salaries of the anthropologists in work after five years.
Summarise the information by selecting and reporting the main features, and make comparisons where relevant.
Write at least 150 words.

Structure Breakdown
| Question Type
Combination Charts Introduction Paraphrase the prompt and mention the time frame. Overview Highlight key features, focusing on changes, highs, lows, and patterns. Avoid specific data details. Main Body Paragraph 1 Diagram 1 – Description of main features + comparisons Main Body Paragraph 2 Diagram 2 – Description of main features + comparisons Note: Separate the description of the main features for each diagram into 2 paragraphs. Be careful not to describe too many main features for each one as this will take up too much time. |
Band 7 Sample Answer For Writing Task 1 Combination Charts – Anthropology Graduates From One University
The pie chart illustrates the employment status of Anthropology graduates from a specific university post-undergraduate degree, while the table shows the salaries of anthropologists across three different employment types after five years.
Overall, the highest percentage of Anthropology graduates opted for full-time employment, whereas the opposite trend was observed for part-time work and postgraduate study.
Regarding the pie chart, the majority of graduates, at 52%, had full-time positions, while part-time workers and the unemployed comprised smaller proportions, at 15% and 12% respectively. Additionally, 8% pursued full-time postgraduate study or had an unknown employment status, while only 5% engaged in part-time work alongside further education.
In the given table, around 5% of Anthropology graduates in freelance consulting and government roles earned between $25,000 and $49,999 annually, contrasting with private sector employees. Conversely, significantly higher percentages, at 40%, 50%, and 30%, respectively, earned the highest salary in freelance consulting, the government sector, and private companies.
(155 Words)
Aspiring to Crack IELTS Writing?
Get expert help today with a FREE demo session! Sign up, Now!
Band 8 Sample Answer For Writing Task 1 Combination Charts – Anthropology Graduates From One University
The table presents the income levels of Anthropology graduates five years into their careers across different sectors, while the pie chart illustrates their initial employment status post-graduation.
Overall, the majority of graduates secured full-time positions, followed by part-time roles, unemployment, further full-time education, unspecified employment status, and a small percentage engaged in part-time work while pursuing additional education.
The pie charts detail that specifically, 52% of graduates found full-time employment and 15% of them opted for part-time roles. Moreover, 12% of the graduates remained unemployed and the rest 8% had undefined employment statuses. Additionally, it is shown that 8% pursued full-time further education and 5% combined part-time work with education.
Based on the table about salary distributions, independent consultants primarily earned high incomes, with 40% earning between $75,000 and over $100,000 annually. Government employees showed a similar pattern, with 50% earning above $100,000, 30% falling into the lower salary brackets, and 30% earning between $75,000 and $99,999. In contrast, salaries in the private sector varied widely, with 10% earning the lowest bracket, 35% in the $50,000–74,999 range, and 25% and 30% in the $75,000–$99,999 and $100,000+ categories, respectively.
(199 Words)
Band 9 Sample Answer For Writing Task 1 Combination Charts – Anthropology Graduates From One University
The table illustrates the income fluctuations among individuals in various industries five years into their employment, while the pie chart delineates the initial job placements of anthropology graduates post-graduation.
Overall, anthropology graduates predominantly secured full-time employment post-graduation, with a smaller proportion engaged in part-time roles or continuing education.
Beginning with the pie chart, it is evident that the majority of anthropology graduates, comprising 52%, secured full-time positions, whereas 15% opted for part-time roles. Moreover, those who remained unemployed contributed to 12% of the total people, while information on the remaining 8% is unavailable. Only 8% of them pursued full-time studies, while a smaller proportion of 5%, engaged in part-time employment alongside postgraduate studies.
Regarding the table, it is shown that the anthropology graduates employed in the public sector enjoyed significantly higher average salaries, with 50% earning over $100,000. This contrasts with their counterparts in independent consulting and the private sector, where only 40% and 30%, respectively, earned similarly high incomes. Furthermore, 20% of public sector employees, including freelance consultants, earned between $25,000 and $74,999. Consequently, graduates entering private enterprises generally earned lower incomes compared to those in the public and consulting sectors.
(195 Words)
Connectors Used in the Above Sample Answers of ‘Anthropology Graduates From One University’
Connectors, also known as connectives or transition words, are words or phrases that link ideas or parts of a sentence or paragraph together. Here are some of the connectors used in the above sample answers:
- Overall
- Regarding
- Additionally
- In the given
- Conversely
- Moreover
- Based on
- In contrast
- Beginning with
- Furthermore
- Consequently
Remember to proofread your essay for grammar, vocabulary, and spelling errors. These tips, combined with practice, will help you write well-structured and coherent IELTS Writing Task 1 Combination charts answers like ‘Anthropology Graduates From One University.’
Useful Links:
- IELTS Academic Writing Task 1 Topic : Newly graduated students in the UK and their proportions – Multiple Graphs
- The table and charts below give information on the police budget – IELTS Writing Task 1
- Percentage of Food Budget the Average Family Spent on Restaurant Meals- Pie Chart + Line Graph | IELTSMaterial.com
- Water use Worldwide and Water Consumption- Line Graph and Table | IELTSMaterial.com
- Amount of Money Per Week Spent on Fast Food in Britain- Bar Graph + Line Graph | IELTSMaterial.com
Practice IELTS Writing Task 1 based on report types

Start Preparing for IELTS: Get Your 10-Day Study Plan Today!
Recent Articles

Nehasri Ravishenbagam

Nehasri Ravishenbagam

Kasturika Samanta


Post your Comments