IELTS Academic Writing Task 1 : Compare and Contrast
Table of Contents

Try AI Essay Checker for Instant Band Score
Like it has already been discussed in all the other TASK 1 lessons, to get a high band score in your Writing Section, you need to use appropriate vocabulary.
In IELTS Writing Task 1, you are commonly provided with graphs, pie charts, etc. which have data that should be compared and contrasted.
In this lesson, you will learn the type of vocabulary that you’ve got to use to compare and contrast information in the graph.
Comparative and Superlatives
To compare any graphs or charts, you need to use comparatives or superlatives.
Comparatives are used when comparing two things.
Jill runs faster than Ted.
Superlatives are used one thing against a group of elements.
Jill runs faster than any other girl in her class.
There are a few basic ways in which these words are formed. They are:
| Example Word | Comparative | Superlative | |
| Words with one syllable | Low | Lower | Lowest |
| Words with three syllables or more | Important | More important | Most important |
| Words ending in –y | Happy | Happier | Happiest |
| Irregular | Good | Better | Best |
Other Vocabulary
Though Comparatives and Superlatives are essential, they aren’t sufficient for an IELTS Task 1 essay. Therefore, we should use other kinds of vocabulary.
Subordinating Conjunctions

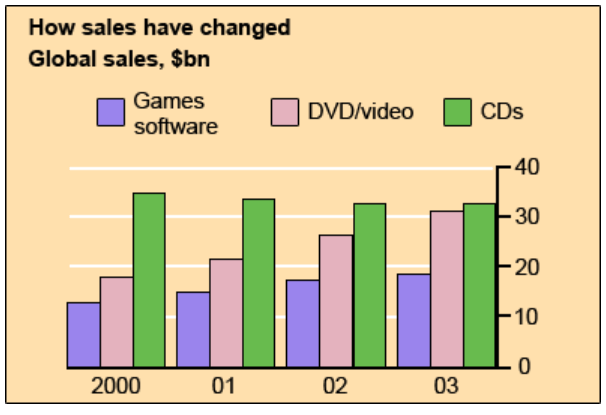
Although the sale prices of the CDS decreased, it remained the same for the year 2002 and 2003.
The sale prices of the CDs decreased in 2001, whereas/while it remained the same in the year 2002 and 2003.
Transitions

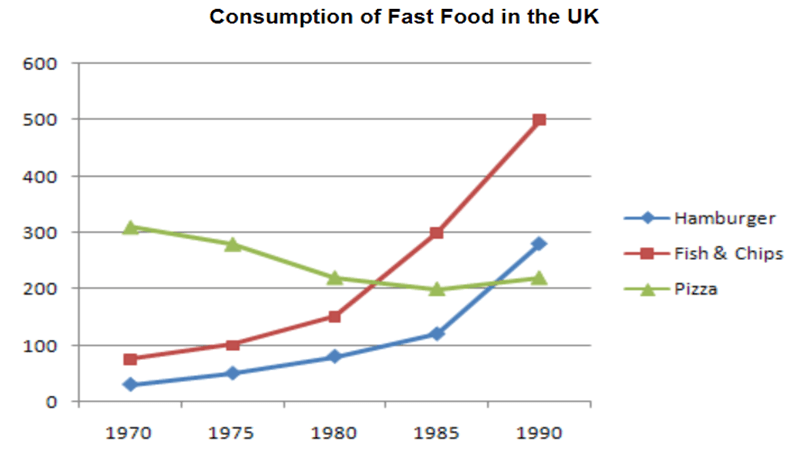
- In 1970, the most popular fast food was pizza, over 300 grams were consumed each week. By 1990, however, this had fallen to just over 200 grams.
- There was a vast increase in the consumption of Fish and Chips. In contrast, there was a drop in the consumption of pizza over the years.
- On the one hand, the consumption of hamburgers increased. On the other hand, the consumption of pizza decreased.
Other Structures

- Like Canada, Japan also has a 99% adult literacy rate.
- Canada has more annual income than all the other four countries.
- The adult literacy rate of Zaire is far less than all the other four countries.
- As observed from the given data, daily calorie supply in Canada and Japan was 3326 and 2846 per person, while this ratio in Peru and Zaire was almost half, with 1927 and 1749 per person.
- Initially, the annual incomes of Canadian and Japanese people were much higher than in Peru and Zaire.
- Zaire’s life expectancy is not as high as Canada’s or Japan’s.
- The economic and social living standards of Canadian and Japanese citizens were far better than those of the people of Peru and Zaire.
Using Approximate Data
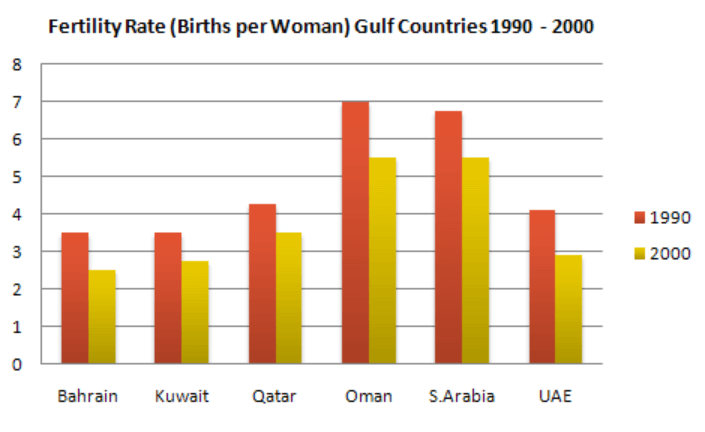
When you are comparing and contrasting, you don’t usually have the exact numbers, like in the chart below. Thus you use appropriate phrases for comparative data.

1.
- In 1990, the fertility rate in Kuwait was just over 3.
- In 1990, the fertility rate in Kuwait was approximately 3.
Here you can see that if your value is above the value mentioned and there is no precise number given, you can use ‘just over’ or ‘approximately.’
2.
- In 2000, the fertility rate in the UAE was nearly 3.
- In 2000, the fertility rate in the UAE was almost 3.
Here you can see that if your value is below the value mentioned and there is no precise number given, you can use ‘nearly’ or ‘almost.’
Also check :
Practice IELTS Writing Task 1 based on report types

Start Preparing for IELTS: Get Your 10-Day Study Plan Today!
Recent Articles

Nehasri Ravishenbagam

Nehasri Ravishenbagam

Kasturika Samanta


Post your Comments
2 Comments