Use of Public Libraries in 1991 and 2000 in Britain - IELTS Academic Writing Task 1
6 min read
Updated On
-
Copy link
Understand how to summarize and compare data, highlight major changes, and use precise language to craft a high-scoring response for IELTS Writing Task 1 pie chart with the topic, ‘Use of Public Libraries in 1991 and 2000 in Britain’ in this blog.
Table of Contents
- Question for Use of Public Libraries in 1991 and 2000 in Britain - IELTS Writing Task 1
- Outline to Frame Your Answer for IELTS Pie Chart
- Sample Answers for Use of Public Libraries in 1991 and 2000 in Britain - IELTS Writing Task 1
- Vocabulary to be Used in Answers for Use of Public Libraries in 1991 and 2000 in Britain
- How to Answer Use of Public Libraries in 1991 and 2000 in Britain IELTS Writing Task 1?

Try AI Essay Checker for Instant Band Score
In IELTS Writing Task 1, candidates are often asked to analyze visual data such as IELTS Task 1 pie chart. One recurring theme is how public institutions like libraries evolve over time. A common question involves comparing the use of public libraries in 1991 and 2000 in Britain. To score high, test-takers must identify key trends, shifts in usage patterns, and make clear comparisons.
In this blog, we will explore 3 sample answers, along with useful tips and vocabulary to describe a graph or chart topic, Use of Public Libraries in 1991 and 2000 in Britain, for a high-scoring response.
Before you move on to the next section of the blog, watch this video and bookmark it as a step-by-step guide for writing your answers for IELTS pie charts along with Band 9 vocabulary.
Question for Use of Public Libraries in 1991 and 2000 in Britain - IELTS Writing Task 1
You should spend about 20 minutes on this task.
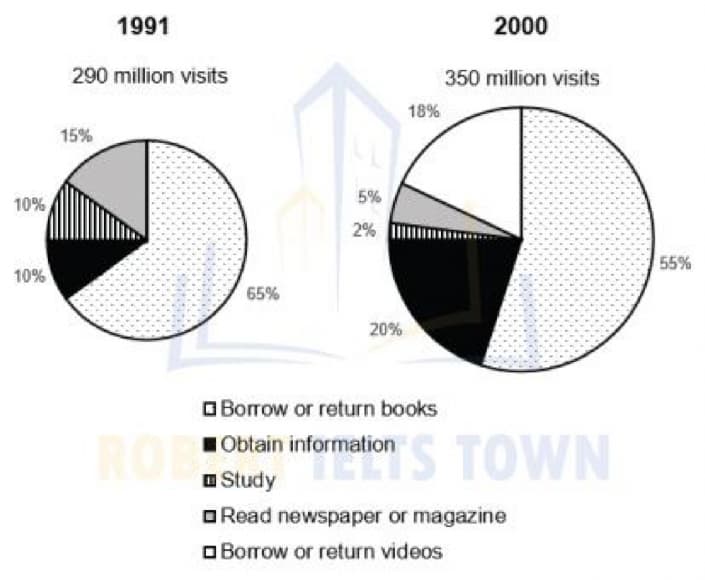
The pie charts show figures for the use of public libraries in 1991 and 2000 in Britain. Summarise the information by selecting and reporting the main features, and make comparisons where relevant.
Write at least 150 words.

Outline to Frame Your Answer for IELTS Pie Chart
|
Introduction (1–2 sentences)
Overview (1–2 sentences)
Body Paragraph 1: 1991 Data (2–3 sentences)
Body Paragraph 2: 2000 Data and Comparison (3–4 sentences)
Summary or Concluding Statement (Optional)
|
Sample Answers for Use of Public Libraries in 1991 and 2000 in Britain - IELTS Writing Task 1
Below are three IELTS Writing Task 1 sample answers on the topic, Use of Public Libraries in 1991 and 2000 in Britain. They will help you write an answer for a band score 9.
Use of Public Libraries in 1991 and 2000 in Britain - Sample Answer 1
The two pie charts illustrate how people in Britain used public libraries in 1991 and 2000. Overall, while reading and borrowing books remained a major purpose in both years, there was a noticeable shift towards non-traditional uses such as accessing information and using multimedia services.
In 1991, the dominant activity was borrowing books, accounting for 65% of library usage. Reading newspapers and magazines followed at 15%, with studying and other uses comprising the rest. By 2000, borrowing books dropped to 55%, although it still represented the highest share. In contrast, using the library for studying increased from 10% to 20%, showing growing academic use. Notably, there was a new category, accessing community information, making up 10%, suggesting diversification in services.
The data reveals a gradual shift in how libraries were perceived, from purely reading spaces to multifunctional community hubs. Although traditional uses declined, newer purposes gained prominence, reflecting societal and technological change.
Boost your IELTS Writing score with expert guidance—join our online webinar now!
Use of Public Libraries in 1991 and 2000 in Britain - Sample Answer 2
The pie charts provide information about the purposes of people who visited public libraries in Britain in two years.
It is evident that the most common use of people going to the libraries was to borrow or return books, and there was a new library’s function in 2000.
Unlock Complete Answer
In 1991, there were 290 million visits to public libraries. In particular, the percentage of people visiting the public library to borrow and return books was 65%, followed by that of those who read the newspaper or magazine with 15%. Also, 10% was the proportion of people obtained information and studied in libraries.
In 2000, although the number of library visits increased by 60 million, Britain experienced a considerable decline in the percentage of visits to borrow and return books. In addition, the proportion of people going to the library to obtain information doubled to 20% while those of studying and reading newspaper and magazine fell sharply to 2% and 5% respectively. Lastly, the new use of the library (borrow and return videos) constituted 18% of total visits.
Grab Our Extensive Bundle for IELTS Writing (Academic) & Ease Your Writing Worries!
Use of Public Libraries in 1991 and 2000 in Britain - Sample Answer 3
The given pie charts compare the purposes for which people in Britain used public libraries in the years 1991 and 2000.
Overall, a clear transformation is evident over the decade, highlighting a move from traditional book-related activities towards broader informational and educational functions.
Unlock Complete Answer
In 1991, borrowing books dominated library use, representing 65% of total activity. Reading newspapers and magazines constituted 15%, while studying and other uses comprised 10% each. However, by 2000, borrowing books declined significantly to 55%. Meanwhile, studying saw a substantial increase, doubling from 10% to 20%, suggesting a growing academic reliance on public libraries.
A particularly striking development was the emergence of 'getting information' as a new category in 2000, accounting for 10%. This likely reflects a response to technological advancements and the internet’s influence. Reading newspapers saw a slight decrease to 10%, and other uses remained unchanged.
In summary, the charts reveal a shift in public library usage from predominantly reading-based functions to more diverse, information-oriented services, mirroring broader changes in user needs and digital accessibility.
Vocabulary to be Used in Answers for Use of Public Libraries in 1991 and 2000 in Britain
Given below are some IELTS Writing Task 1 connectors and phrases that can be used while framing the answers for 'Use of Public Libraries in 1991 and 2000 in Britain' to make it a top scoring responses.
- The pie charts provide information about
- It is evident that
- In particular
- Followed by
- The proportion of people
- A considerable decline
- Doubled to
- Fell sharply to
- Constituted
How to Answer Use of Public Libraries in 1991 and 2000 in Britain IELTS Writing Task 1?
When describing pie chart-based questions in IELTS Writing Task 1, like ‘Use of Public Libraries in 1991 and 2000 in Britain’, you need to compare the given pie charts for the different time periods, highlighting key changes over time. Below are five top writing techniques for the IELTS Writing section on how to answer this task effectively.
- Identify the biggest and smallest categories in both years: Start by pointing out what purpose was most popular and least popular in each year. This helps define your comparisons clearly.
- Use comparative language: Use phrases like ‘increased to’, ‘declined from’, ‘remained the same’, ‘newly introduced’, or ‘replaced by’ to describe changes. Remember, using appropriate IELTS vocabulary will create a high-scoring answer as lexical resources is an important IELTS marking criterion.
- Group similar data: Do not describe each segment in isolation. You can group similar or contrasting trends together, such as traditional vs modern uses.
- Mention the emergence of new categories: Highlight and explain the significance of any new additions in the second chart, like ‘getting information’ in 2000.
- Avoid personal opinions or explanations: Focus strictly on the data provided. Do not add your personal opinion on why the changes happened unless the trend is obvious and neutral (e.g., ‘possibly due to the rise of digital information’).
Finally, we hope you have understood how to write an analytical paragraph in 100- 150 words by selecting and reporting the main features, and making comparisons where relevant on the topic, Use of Public Libraries in 1991 and 2000 in Britain. Also, make sure to take up more IELTS Writing practice tests and be prepared to score band 8+ in IELTS Writing.
Useful Links:
- Main Methods of Transportation for People Traveling to a University - IELTS Pie Chart
- Percentage of Water Used for Different Purposes in Six Areas of the World- IELTS Pie Chart
- IELTS Academic Writing Task 1 Topic 13: Percentage of housing owned and rented in the UK – Pie Chart
- Recent IELTS Writing Task 1 Topics Academic with Model Answers
- 50+ Recent IELTS Writing Topics with Answers: Essays & Letters
- 21+ Tips On How to Improve Your IELTS Writing Band Score
Explore IELTS Writing

Start Preparing for IELTS: Get Your 10-Day Study Plan Today!
Explore other Writing Task 1 Articles
Recent Articles
Haniya Yashfeen

Kasturika Samanta


Post your Comments