People Who Ate Five Portions of Fruits and Vegetables Per Day in the UK – IELTS Writing Task 1
5 min read
Updated On
-
Copy link
Get all set to read the band 7, 8, and 9 sample answers of the ‘People Who Ate Five Portions of Fruits and Vegetables Per Day in the UK IELTS Writing Task 1 Bar Chart' and their vocabulary list here!
Table of Contents
- Question
- Structure Breakdown
- Band 7 Sample Answer – People Who Ate Five Portions of Fruits and Vegetables Per Day in the UK
- Band 8 Sample Answer – People Who Ate Five Portions of Fruits and Vegetables Per Day in the UK
- Band 9 Sample Answer – ‘People Who Ate Five Portions of Fruits and Vegetables Per Day in the UK’
- Connectors Used in the Above Sample Answers of ‘People Who Ate Five Portions of Fruits and Vegetables Per Day in the UK’
- Useful Links:

Try AI Essay Checker for Instant Band Score
In IELTS Writing Task 1 of the academic section, there will be a visual representation like ‘People Who Ate Five Portions of Fruits and Vegetables Per Day in the UK’ which you have to write a report about.
A IELTS bar chart also comes with two axes, showing changes and diversifications over a given period. Furthermore, the bar graph has rectangular bars that could be either displayed vertically or horizontally, representing two or more values of data. Elements of the bar chart include the layout, the figures, the contrasts, and the similarities.
Let’s now have a look at the bar chart – ‘People Who Ate Five Portions of Fruits and Vegetables Per Day in the UK’ – with three expert-curated sample answers for different IELTS band scores ranging from band 7-9.
Question
You should spend no more than 40 minutes on this task.
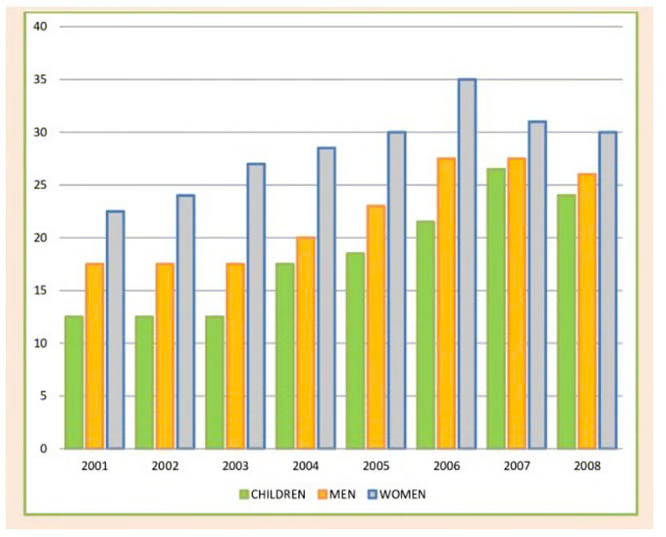
The bar chart shows the percentage of people who ate five portions of fruits and vegetables per day in the UK from 2001 to 2008.
Summarize the information by selecting and reporting the main features, and make comparisons wherever relevant.
You should write at least 250 words.

Structure Breakdown
Question Type
Introduction
Overview
Main Body Paragraph 1
Main Body Paragraph 2
|
Band 7 Sample Answer – People Who Ate Five Portions of Fruits and Vegetables Per Day in the UK
The bar chart shows the proportion of men, women, and children in the UK consuming five portions of fruits and vegetables daily between 2001 and 2008.
Overall, there is a notable increase in this kind of food consumption across all the mentioned groups, followed by a gradual decline towards the end.
To begin with, in general, there was an upward trend in consumption for all categories throughout the entire period. Notably, children and men experienced significant increases, while women showed a more moderate rise. The proportion of women consuming fruits and vegetables started at 21% in 2001 and steadily peaked at 35% in 2006 before declining to 30% by the year 2008.
On the other hand, children’s fruit and vegetable consumption in the UK rose from 12% in 2001 and reached up to 27% in 2007, with a slight decline to 25% in 2008. Similarly, the men of the UK consumed the mentioned diet at a stagnant percentage of around 12% for the first three years (2001-2003), gradually increasing to 27% by 2007 before a slight decrease thereafter.
(176 Words)
Aspiring to questions like the bar chart of IELTS Writing Task 1?
Sign Up For a FREE Demo Session Now!
Band 8 Sample Answer – People Who Ate Five Portions of Fruits and Vegetables Per Day in the UK
The presented graph highlights the proportion of the UK population consuming fruits and vegetables five times a day as a routine from 2001 to 2008.
Overall, there was a consistent upward increase across all the demographics, with notable increases for children and men, and a more moderate rise for women in the UK.
First off, children had the lowest percentage, starting at approximately 12% in 2001 and maintaining stability in the numbers until the year 2003, then steadily increasing to around 25% by 2007. Similarly, men experienced a similar trend, starting at about 17% in 2001, remaining unchanged for the next two years, before facing a sudden incline to nearly 27% by the year 2007. However, both groups witnessed a gradual decline in the final year, 2008.
In contrast, women began with the highest percentage in 2001, around 21%. Moreover, this gradually increased to about 34% by the year 2006. But, eventually, the numbers then dropped by almost 3% in the last two years. Despite all of this, the population of women remained at the top in the UK by the year 2008.
(185 Words)
Band 9 Sample Answer – ‘People Who Ate Five Portions of Fruits and Vegetables Per Day in the UK’
The given graph shows the proportion of the UK population following the dietary recommendation of consuming fruit and vegetables five times daily from 2001 to 2008.
Overall, there was an increase observed across the UK during the mentioned period, with a notable gap in the growth rates among children, men, and women.
Initially, the percentage of children meeting the dietary guideline stood at approximately 12% in 2001, maintaining a steady state until 2003 before experiencing a consistent rise, peaking at around 25% in 2007. Similarly, the proportion of men was roughly at 17% in the year 2001, showing lesser change in the amount in the next two years. Then, the percentage of men had a sharp increase of around 27% by 2007.
On the other hand, the percentage of women who the mentioned proportions of fruits and vegetables a day in 2001 was the highest among the said categories. Over the period from 2001 to 2006, there was a gradual increase in their numbers, rising from around 21% to 34%, and experiencing a slight decline of nearly 3% in the final two years. Anyways, women remained as the highest population in 2008 compared to men and children.
(170 Words)
Connectors Used in the Above Sample Answers of ‘People Who Ate Five Portions of Fruits and Vegetables Per Day in the UK’
Connectors, also known as connectives or transition words, are words or phrases that link ideas or parts of a sentence or paragraph together. Here are some of the connectors used in the above sample answers:
- Overall
- To begin with
- Notably
- On the other hand
- First off
- Similarly
- However
- In contrast
- Eventually
- Despite all of this
- Over the period
- In contrast
- Anyways
Remember to proofread your essay for grammar, vocabulary, and spelling errors. These tips, combined with practice, will help you write well-structured and coherent IELTS Writing Task 1 Line graph answers like ‘People Who Ate Five Portions of Fruits and Vegetables Per Day in the UK.’
Useful Links:
- IELTS Academic Writing Task 1 Topic 03: Production of the world’s oil in OPEC and non-OPEC countries – Bar chart
- IELTS Academic Writing Task 1 Topic 22: Railway system in six cities in Europe – Bar Chart
- IELTS Academic Writing Task 1 Topic 24: Hours worked and stress levels amongst professionals in eight groups – Graph
- IELTS Academic Writing Task 1 Topic 31: Number of minutes of telephone calls in Australia – Bar Chart
Practice IELTS Writing Task 1 based on report types

Start Preparing for IELTS: Get Your 10-Day Study Plan Today!
Recent Articles

Nehasri Ravishenbagam

Nehasri Ravishenbagam

Kasturika Samanta


Post your Comments