IELTS Academic Writing Task 1 Topic 37: Visitors to three London Museums between 2007 and 2012 – Bar chart
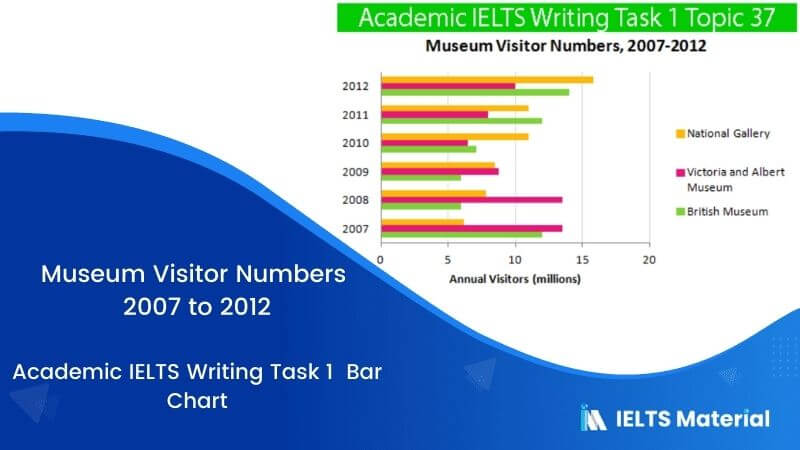
Table of Contents

Try AI Essay Checker for Instant Band Score
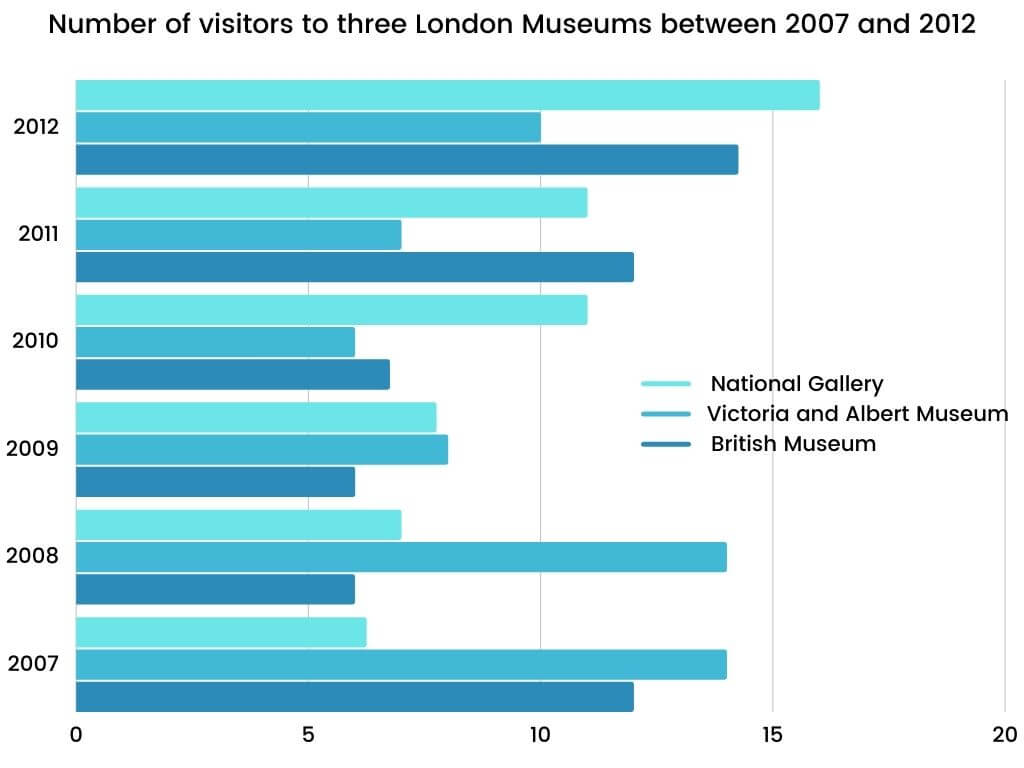
The bar chart shows the number of visitors to three London Museums between 2007 and 2012.
Summarize the information by selecting and reporting the main features, and make comparisons where relevant.
Write at least 150 words
Report Plan
Paraphrase: shows>compares; the number of visitors to three London Museums between 2007 and 2012>visitors to three museums in London from the time period of 2007 to 2012
Overview: The bar graph compares visitors to three museums in London from 2007 to 2012.
Paragraph 2: (1) compare the data for different museums throughout a period of time. Give figures.
Paragraph 3: (1) compare the data for different museums throughout a period of time. Give figures.
Paragraph 4: (1)compare the data for different museums throughout a period of time. Give figures.
Sample Answer
The given bar graph compares visitors to three museums in London from the time period of 2007 to 2012. Generally speaking, in 2012, the two most attractive places were National Gallery and the British museums. However, Victoria and Albert Museum were more popular in the initial years.
As per the data, National Gallery acquired the least number of visitors, roughly 6 million, in 2007. However, by 2012, the number of visitors gradually increased to make it the most visited museum in London. In the said year, approximately 16 million people visited National Gallery.
In 2007, Victoria and Albert Museum saw the largest number of visitors, accounting for nearly 13 million. For two consecutive years, 2007 and 2008, it remained the most acknowledged touristy place among the three. However, its popularity sharply declined afterwards. From 2010 to 2012, the museum managed to attract only a few spectators; thereby, standing at the last position.
Lastly, the British Museum turned out to be the second most famous museum during 2007 with almost 12 million visitors. However, in the next three subsequent years, the number declined to a great extent. In 2011, it was the most visited museum in London. The next year, it dropped down to the second most toured place with nearly 14 million visitants.
Get evaluated for FREE!
Got a quick report in your mind for this question. Don’t hesitate to post the same in our comment section. We will evaluate the report/letter and email you the band score & our trainer’s comments. And, this service is entirely free.
Also check:
Practice IELTS Writing Task 1 based on report types

Start Preparing for IELTS: Get Your 10-Day Study Plan Today!

Explore other sample Bar Charts


Recent Articles

Nehasri Ravishenbagam


Nehasri Ravishenbagam

Kasturika Samanta


Post your Comments