IELTS Academic Writing Task 1 Topic 40: Number of houses built per year in two cities Derby and Nottingham – Bar Chart
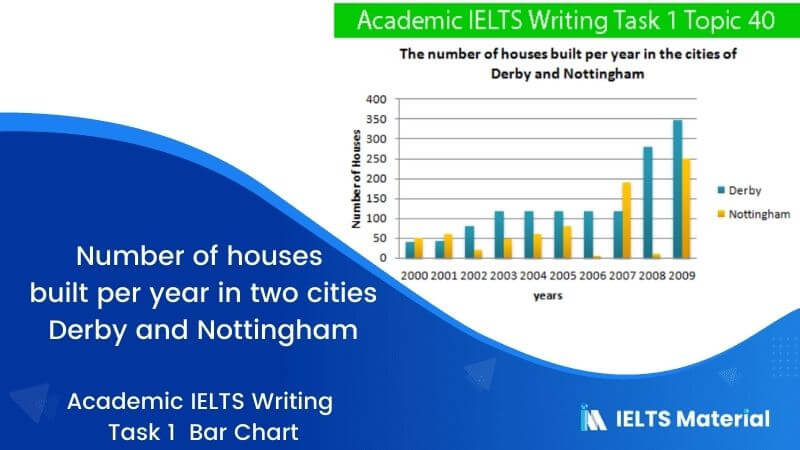
Table of Contents

Try AI Essay Checker for Instant Band Score
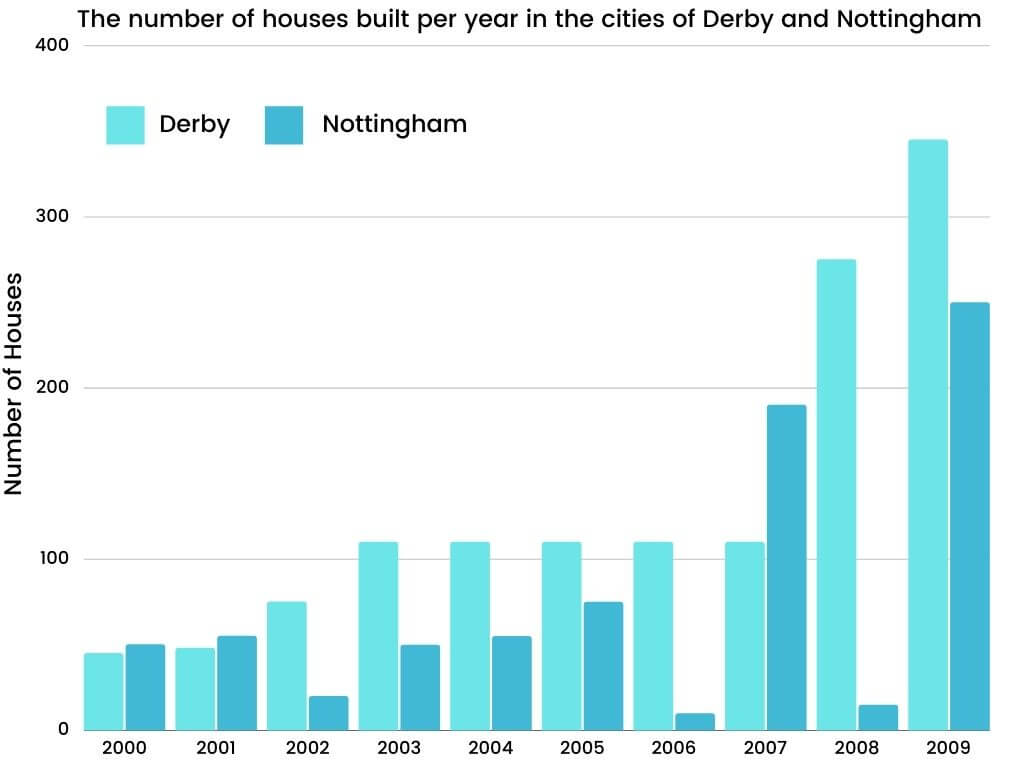
The bar chart below shows the number of houses built per year in two cities, Derby and Nottingham, Between 2000 and 2009.
Write a report for a university lecturer describing the information shown below.
Write at least 150 words.
Report Plan
Paraphrase: shows>outlines; number of houses built per year >number of houses constructed annually
Overview: The bar graph outlines the drinking pattern of Americans based on their age groups.
Paragraph 2: (1) compare the number throughout different periods. Give figures.
Paragraph 3: (1) compare the number throughout different periods. Give figures.
Sample Answer
The given chart outlines the number of houses constructed annually in Derby and Nottingham cities from the time period of 2000 to 2009. All in all, Derby had more homes built in comparison to Nottingham each year, except in 2000, 2001 and 2007.
As per the graph, in 2000, merely 50 houses were constructed in Nottingham whereas this number was around 45 in Derby. Post two years, there was a significant change in the trend, and more houses were built in the former city than the latter.
Until 2005, the trend remained almost consistent. In this year, more than 100 houses were constructed in Derby while Nottingham saw a number less than 80. Interestingly, the number of houses built in Nottingham was extremely less, even less than 10, in 2006 and 2008. On the other hand, the number was much higher in Derby. In 2007, there seems to be a reverse trend that shows more than 190 houses were constructed in Nottingham compared to 110 dwellings in Derby. Lastly, in 2009, Derby saw the construction of more than 240 homes, and Nottingham had the number at 250.
Get evaluated for FREE!
Got a quick report in your mind for this question. Don’t hesitate to post the same in our comment section. We will evaluate the report/letter and email you the band score & our trainer’s comments. And, this service is entirely free.
Also check :
- IELTS Writing Task 1
- IELTS Writing Task 1 Bar chart
- IELTS Pie chart
- IELTS Table chart
- IELTS Writing task 1 line graph
- IELTS Writing task 1 Map
- IELTS Writing task 1 tips
- Tips to Improve IELTS Writing Skills
- IELTS Writing recent actual test
- IELTS Writing Answer sheet
- IELTS map vocabulary
- IELTS Writing Task 1 Connectors
Practice IELTS Writing Task 1 based on report types

Start Preparing for IELTS: Get Your 10-Day Study Plan Today!

Explore other sample Bar Charts

Recent Articles

Nehasri Ravishenbagam


Nehasri Ravishenbagam

Kasturika Samanta


Post your Comments
2 Comments