The Percentage of Female Members of Parliament in 5 European Countries - IELTS Academic Writing Task 1 (Line Graph)
Master IELTS line graph topics like ‘The Percentage of Female Members of Parliament in 5 European Countries’ to approach them on the IELTS exam confidently. Analyze the outline, sample answers & learn how to describe data to boost your writing band score.
Table of Contents
- Question for The Percentage of Female Members of Parliament in 5 European Countries - IELTS Academic Writing Task 1
- Outline for IELTS Writing Task 1 Line Chart
- Sample Answers on ‘The Percentage of Female Members of Parliament in 5 European Countries'
- Tips for IELTS Writing Task 1 Line Chart - Percentage of Female Members of Parliament in 5 European Countries

Try AI Essay Checker for Instant Band Score
The IELTS Academic Writing Task 1 often features line graphs, and one increasingly common theme is gender representation in politics, for example, the percentage of female members of parliament in 5 European countries. Understanding how to describe trends, comparisons, and significant changes is crucial for this type of task, especially if you want to score a 7+ band score.
In this blog, we will examine how to approach a Task 1 question based on an IELTS Writing Task 1 line graph, 3 sample answers on ‘The Percentage of Female Members of Parliament in 5 European Countries’, and tips related to IELTS line chart writing sample answers.
Question for The Percentage of Female Members of Parliament in 5 European Countries - IELTS Academic Writing Task 1
You should spend about 20 minutes on this task.
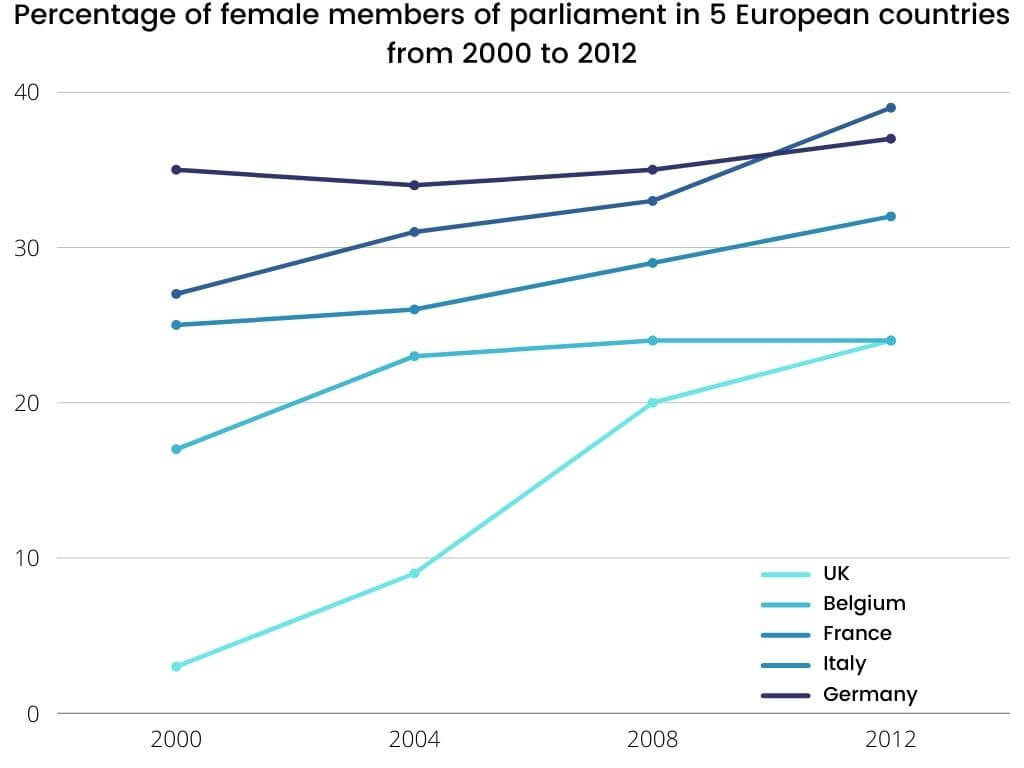
The chart below shows the percentage of female members of parliament in 5 European countries from 2000 to 2012. Summarise the information by selecting and reporting the main features, and make comparisons where relevant.
Write at least 150 words.
Outline for IELTS Writing Task 1 Line Chart
Given below is a detailed structure that will assist you in organizing your answer for IELTS Writing Task 1 line charts.
|
Need expert advice on tackling IELTS line charts?
Book a free trial & talk to our experts NOW!
Sample Answers on ‘The Percentage of Female Members of Parliament in 5 European Countries'
The line graph for ‘The Percentage of Female Members of Parliament in 5 European Countries IELTS Writing Task 1’ shows a steady increase in the percentage of female members of parliament across five European countries from 2000 to 2019, with Germany and Belgium maintaining the highest representation by the end of the period. In contrast, Italy and France started with lower percentages but saw gradual improvements, while the UK showed moderate but consistent growth.
Now let us have a look at the sample answers for 'The Percentage of Female Members of Parliament in 5 European Countries' below, which will give you an idea of how to frame your IELTS Academic Writing Task 1 answers with clarity.
Percentage of Female Members of Parliament in 5 European Countries - Sample Answer 1
The graph provides an outline of the proportion of female representatives of Parliament in five different European countries including Belgium, Italy, France, the UK, and Germany over the period from 2000 to 2012.
We can observe from the line graph that all five European countries experienced an upward trend in their percentages of female members of Parliaments (MPs). The country with the highest level of female representatives was Germany, while the figures for the United Kingdom (UK) were the lowest over the period.
In the year 2000, Germany witnessed the highest rate of female participants for the MPs in Europe at around one-third, followed by 17% in Belgium, 25% in France, and 27% in Italy. In contrast, the figures for the UK were at merely 3%. Over the years, there was a dramatic increase in the proportion of female representatives of Parliament in the UK and Germany.
Italy had significant growth with 40% at the end of the period in 2012, surpassing the figure of Germany, which was 37%. There was a gradual rise in the proportion of female members in Parliament in the UK and France. The figures for France rapidly increased to 32%, and the UK witnessed a substantial increase from 3% in 2000 to 24% and was at the same level as Belgium in 2012.
Join a FREE online webinar to learn how to deal with IELTS line graphs for IELTS success!
Percentage of Female Members of Parliament in 5 European Countries - Sample Answer 2
The line graph illustrates the proportion of female parliamentarians in five European countries over a 19-year period from 2000 to 2019.
Overall, all five countries experienced an upward trend in the percentage of women in parliament. Belgium and Germany had the highest figures by the end of the period, while France and Italy remained lower in comparison.
In 2000, Germany and the UK had around 30% and 22% female MPs, respectively. Germany saw a consistent increase, reaching nearly 40% by 2019. The UK followed a slower upward trend, ending at about 32%. Meanwhile, Belgium started at a relatively high figure of around 25% and climbed steadily, eventually overtaking the UK by a small margin.
France and Italy had the lowest figures throughout the period. Italy started with only about 10%, but this more than doubled by 2019, reaching around 22%. France showed slight fluctuations but overall maintained a moderate growth pattern, finishing just above 25%.
Get expert feedback for your answers with get improvement tips
All you need to do is submit your IELTS Writing Essay for evaluation!
Percentage of Female Members of Parliament in 5 European Countries - Sample Answer 3
The line graph compares the percentage of women serving as members of parliament in five European nations—Germany, France, Italy, Belgium, and the United Kingdom—between 2000 and 2019.
It is clear that all countries witnessed a gradual increase in female parliamentary representation over the two decades, with Germany and Belgium exhibiting the highest percentages by 2019, while Italy and France remained comparatively lower throughout.
Germany consistently led in female parliamentary representation, rising from approximately 31% in 2000 to nearly 40% in 2019. Belgium showed a steady upward trajectory, growing from just under 25% to almost 38%, closely aligning with Germany by the end. The UK experienced modest growth, increasing from around 22% to approximately 32%, while remaining below the levels seen in Germany and Belgium.
In contrast, Italy started at a mere 10% in 2000, but saw the most pronounced relative increase, more than doubling to about 22% in 2019. France followed a relatively flat trajectory in the early years, but saw a late surge after 2010, finishing slightly above Italy. While the gap among countries narrowed over time, significant differences in representation levels remained.
Access the latest IELTS Writing Task 1 line graphs with our IELTS Writing Task 1 Academic Course!
Tips for IELTS Writing Task 1 Line Chart - Percentage of Female Members of Parliament in 5 European Countries
To achieve a Band 9 score on the ‘The Percentage of Female Members of Parliament in 5 European Countries’ line graph, you must go beyond simply describing figures. Let us check out some IELTS exam preparation tips for band score of 8+ in similar IELTS line graphs.
- Group countries by trend: Instead of describing each country separately, group them based on similar patterns. For example, in this graph, Germany and Belgium can be grouped as consistently high performers. They began with relatively high percentages of female MPs and maintained steady growth, ending at the top by 2019. Grouping helps you avoid repetition, demonstrate comparison skills, and organise your response logically.
- Note major shifts in trends or data: Crossovers are important because they reflect shifts in rank or performance over time. For example, if Belgium overtakes the UK mid-way through the graph, or France surpasses Italy, these moments should be mentioned to show dynamic changes. Highlighting such shifts indicates that you’ve read the graph carefully and can compare changes, not just describe isolated trends.
- Watch the axes carefully: It is common for IELTS test takers to misread time frames or percentage values, especially when changes are gradual or when the scale is narrow. Always examine the y-axis (percentage scale) and the x-axis (years) before beginning your description.
- Avoid bias; focus on given data only: It is important to remain neutral and objective. You are not expected to express personal opinions about gender equality or national politics. Use factual, descriptive language such as ‘Germany had the highest percentage throughout the period’ or ‘Italy saw a notable increase after 2010’.
To conclude, describing a line graph like ‘The Percentage of Female Members of Parliament in 5 European Countries’ is a great opportunity to demonstrate your ability to interpret long-term trends and compare multiple variables. By mastering a clear structure, using topic-specific vocabulary, and highlighting noteworthy comparisons, you can easily achieve a Band 8 or 9 in IELTS Academic Writing Task 1. For more IELTS writing practice tests and model answers, keep exploring our blog. Do not forget to practice with similar line graphs on education, employment, and gender equality to expand your range.
Useful Links:
- Books Read by Men and Women at Burnaby Public Library - IELTS Writing Task 1
- The Changes In Ownership Of Electrical Appliances And Amount Of Time Spent Doing Housework In Households - IELTS Writing Task 1
- IELTS Academic Writing Task 1 – Shops that Closed With
- Different Sources of Air Pollutants in the UK - IELTS Academic Writing Task 1 Line Graph
- 21+ Tips On How to Improve Your IELTS Writing Band Score
- Recent IELTS Writing Actual Test & Model Answers
- IELTS Writing Answer Sheet
Practice IELTS Writing Task 1 based on report types

Start Preparing for IELTS: Get Your 10-Day Study Plan Today!

Explore other sample Line Graphs


Nehasri Ravishenbagam
Recent Articles

Nehasri Ravishenbagam


Nehasri Ravishenbagam

Kasturika Samanta


Post your Comments
2 Comments