IELTS Academic Writing Task 1 Topic : Percentage of Car Ownership in Great Britain – Line Graph
2 min read
Updated On
-
Copy link
Table of Contents

Try AI Essay Checker for Instant Band Score
Describe Image is one of the most complicated tasks in the IELTS Writing module. Without a sound plan, it can be difficult to perform well on the Describe Image exercise. The Line Graph is the ideal format for practising the Describe Image problem because it has logically and simply organised all of the components. Elements of the Line Graph include the title, the legend, the X-Axis, and the Y-Axis.
Report Plan
Paraphrase: percentage of car ownership>proportions of car owned;
Overview: The graph demonstrates the proportion of cars owned by household members from 1961 to 2001 in Great Britain.
Paragraph 2: (1) Talk about how the graph appears at a glance. Give figures.
Paragraph 3: (1) Compare percentages for different households. Give figures.
Paragraph 4: (1) Compare percentages for different households. Give figures.
Sample Answer
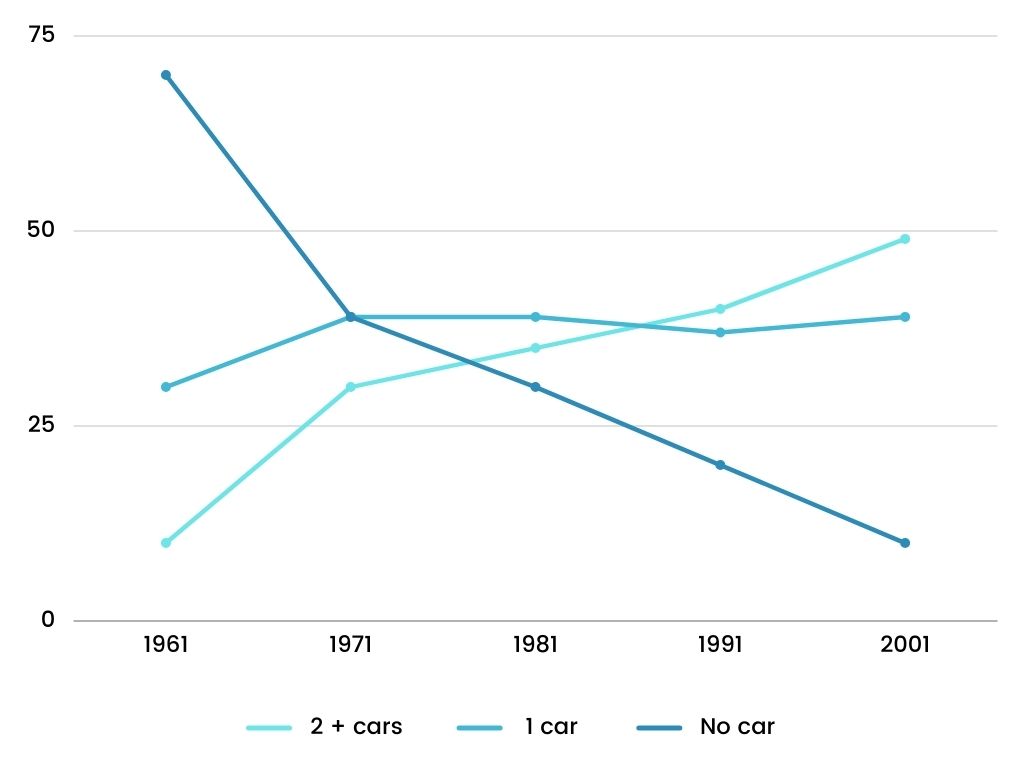
The line graph demonstrates the proportion of cars owned by household members from 1961 to 2001 in Great Britain.
At a glance, there were noteworthy upsurges in the fraction of households with one, two or more cars. Contrary to this, a dramatic decline can be seen in the proportion of households without a car.
In 1961, merely 10% of households owned two or more cars in comparison with nearly 30% with one car. After ten years, these two percentages had increased to 30% and 38%, respectively. However, by 2001 the fraction for houses with two or more cars had mounted to 48%, overtaking the percentage of those with one car, which stayed constant at 38% after 1981.
In terms of households without a car, the figure witnessed a sharp reduction. The percentage fell from 70% in 1961 to 40% in 1971. And then, the percentages continued declining to a low point of only 10% in 2001.
Get evaluated for FREE!
Got a quick report in your mind for this question. Don’t hesitate to post the same in our comment section. We will evaluate the report/letter and email you the band score & our trainer’s comments. And, this service is entirely free.
Also check :
Practice IELTS Writing Task 1 based on report types

Start Preparing for IELTS: Get Your 10-Day Study Plan Today!

Explore other sample Line Graphs
Recent Articles

Nehasri Ravishenbagam


Nehasri Ravishenbagam

Kasturika Samanta


Post your Comments