How Families in One Country Spent their Weekly Income in 1968 and 2018 – IELTS Writing Task 1
5 min read
Updated On
-
Copy link
Explore sample IELTS Academic Writing Task 1 responses for an IELTS bar graph, ‘How Families in One Country Spent their Weekly Income in 1968 and 2018’. Achieve a band 9 by learning to analyze trends, compare data, and structure essays effectively.

Table of Contents
- Question for How Families in One Country Spent their Weekly Income in 1968 and 2018
- Structure Breakdown
- Band 7 Sample Answer for ‘How Families in One Country Spent their Weekly Income’
- Band 8 Sample Answer for ‘How Families in One Country Spent their Weekly Income’
- Band 9 Sample Answer for ‘How Families in One Country Spent their Weekly Income’
- Connectors Used in the Above Sample Answers of ‘How Families in One Country Spent their Weekly Income’

Try AI Essay Checker for Instant Band Score
In IELTS Writing Task 1 of the academic section, there will be a visual representation in the form of bar graph, like ‘How Families in One Country Spent Their Weekly Income in 1968 and 2018’, which you have to write a report about. In this particular bar chart, you will have to compare household spending patterns over two different years, identify trends, and report key differences clearly and objectively.
So, let’s have a look at the IELTS bar chart – ‘How Families in One Country Spent their Weekly Income’ – with three expert-curated sample answers for different IELTS band scores ranging from band 7-9.
Question for How Families in One Country Spent their Weekly Income in 1968 and 2018
You should spend about 20 minutes on this task.
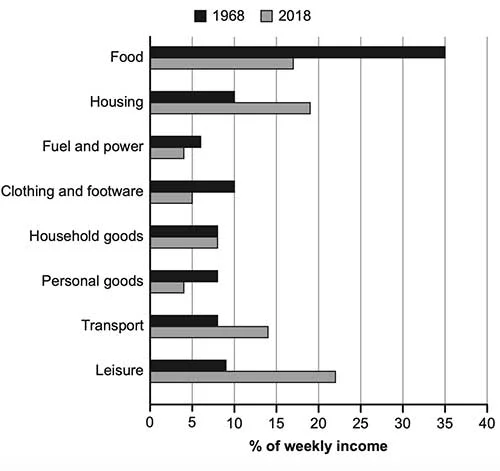
The chart below gives information about how families in one country spent their weekly income in 1968 and 2018. Summarize the information by selecting and reporting the main features, and make comparisons wherever relevant.
Write at least 150 words.
1968 and 2018: Average Weekly Spending by Families
Structure Breakdown
|
Introduction
Overview
Main Body Paragraph 1
Main Body Paragraph 2
|
Band 7 Sample Answer for ‘How Families in One Country Spent their Weekly Income’
The presented bar chart depicts the distribution of weekly household incomes in both 1968 and 2018.
Overall, a significant evolution in the household’s spending habits over the fifty-year period is seen, emphasizing the increasing importance of leisure activities and housing costs in the present compared to the priorities seen then.
Initially, in 1968, the primary concerns for families were food, followed by housing, clothing, and footwear. However, a significant transformation occurred in 2018, when leisure activities emerged as the primary focus for communities. In 2018, households allocated 35% of their income to food, with housing and clothing each representing 15% of expenditures. On the other hand, fuel and power expenses remained modest, constituting just over 5% of the overall budget.
A noteworthy shift in spending patterns is evident in 2018, with leisure activities accounting for around 22% of expenses, surpassing food expenditures, which comprised about 18% of the budget. Moreover, housing costs also experienced a substantial increase, exceeding food expenses and representing approximately 28% of the total budget. (167 Words)
Aspiring to questions like the bar chart of IELTS Writing Task 1?
Sign Up For a FREE Demo Session Now!
Band 8 Sample Answer for ‘How Families in One Country Spent their Weekly Income’
The provided bar chart illustrates the weekly expenditures of families in a country from 1968 to 2018.
Overall, it is evident that while food consumption dominated earlier years, later periods witnessed an increased focus on leisure activities and housing.
In 1968, families allocated around 35% of their weekly income towards food expenditures. However, by 2018, this percentage had significantly decreased to slightly over 20%. During the same period in 1968, spending on housing and clothing accounted for 10%, while expenditures on fuel amounted to just over 5% of their weekly earnings.
In contrast, leisure activities emerged as the primary spending category for families in 2018, constituting approximately 22% of their weekly wages. Housing followed closely as the second priority, with families dedicating nearly 20% of their income to accommodation. Despite being the least substantial expense in 2018, fuel and power, along with personal goods, experienced a decline. However, spending on household goods remained consistent across both periods. (157 Words)
Do you have an essay on the ‘How Families in One Country Spent Their Weekly Income’ topic? Post it!
Band 9 Sample Answer for ‘How Families in One Country Spent their Weekly Income’
The provided bar graph illustrates the spending patterns of the average family in a particular country in the years 1968 and 2018. Notably, there have been substantial shifts in expenditure over the decades, with leisure and housing surpassing food as the primary areas of financial allocation.
Overall, the way families spent their income had changed significantly by the current year compared with the past. To mention, leisure and housing had overtaken food as the largest areas of expenditure.
In 1968, the majority of family income, at 35%, was spent on food expenses. However, by 2018, this proportion had nearly halved, dropping to approximately 17%. During the earlier period, no other spending category exceeded 10% of the weekly income. In contrast, in 2018, both leisure and housing experienced a noteworthy surge, emerging as the predominant expenditures, constituting around 22% and 19% of family income, respectively.
The allocation for transport also saw an increase, reaching almost 15% of the weekly income. Expenditure on household goods remained relatively constant at around 7%. Conversely, spending on clothing and footwear, fuel and power, as well as personal goods, all witnessed a decline, each representing no more than 5% of the weekly income.
(198 Words)
Connectors Used in the Above Sample Answers of ‘How Families in One Country Spent their Weekly Income’
IELTS Writing Task 1 Connectors, also known as connectives or transition words, are words or phrases that link ideas or parts of a sentence or paragraph together. Here are some of the connectors used in the above sample answers for 'How Families in One Country Spent their Weekly Income in 1968 and 2018':
- Overall
- Notably
- To mention
- In contrast
- Conversely
- Initially
- However
- On the other hand
- Noteworthy
- Moreover
To sum up, when you practice IELTS bar graph, remember to proofread your essay for grammar, vocabulary, and spelling errors. Taking the IELTS Writing practice tests will help you write well-structured and coherent IELTS Writing Task 1 bar graph answers like ‘How Families in One Country Spent their Weekly Income.’
Useful Links:
- IELTS Academic Writing Task 1 Topic 03: Production of the world’s oil in OPEC and non-OPEC countries – Bar chart
- IELTS Academic Writing Task 1 Topic 22: Railway system in six cities in Europe – Bar Chart
- IELTS Academic Writing Task 1 Topic 24: Hours worked and stress levels amongst professionals in eight groups – Graph
- IELTS Academic Writing Task 1 Topic 31: Number of minutes of telephone calls in Australia – Bar Chart
Practice IELTS Writing Task 1 based on report types

Start Preparing for IELTS: Get Your 10-Day Study Plan Today!

Explore other Writing Actual Tests


Recent Articles

Nehasri Ravishenbagam


Nehasri Ravishenbagam

Kasturika Samanta


Post your Comments