Information about Computer Ownership as a Percentage of the Population - IELTS Academic Writing Task 1
5 min read
Updated On
-
Copy link
Explore sample IELTS Academic Writing Task 1 responses for an IELTS bar graph, ‘Information about Computer Ownership as a Percentage of the Population’. Learn how to analyze trends, compare data, and structure your essay effectively for a band 9 score.
Table of Contents
- Question for Information about Computer Ownership as a Percentage of the Population - IELTS Writing Task 1
- Outline to Frame Your Answer for IELTS Bar Graph
- Sample Answers for Information about Computer Ownership as a Percentage of the Population - IELTS Writing Task 1
- How to Answer Information about Computer Ownership as a Percentage of the Population IELTS Writing Task 1?

Try AI Essay Checker for Instant Band Score
In the IELTS Writing Task 1, candidates are often presented with data in the form of bar graphs, line charts, pie charts, or tables. Understanding how to approach this task is essential for answering questions like ‘Information about Computer Ownership as a Percentage of the Population’ and achieving a high band score.
Therefore, in this blog, we will analyze an IELTS bar graph showing computer ownership trends, provide three sample answers at different band levels, and offer five tips on how to approach similar questions effectively.
Question for Information about Computer Ownership as a Percentage of the Population - IELTS Writing Task 1
You should spend about 20 minutes on this task.
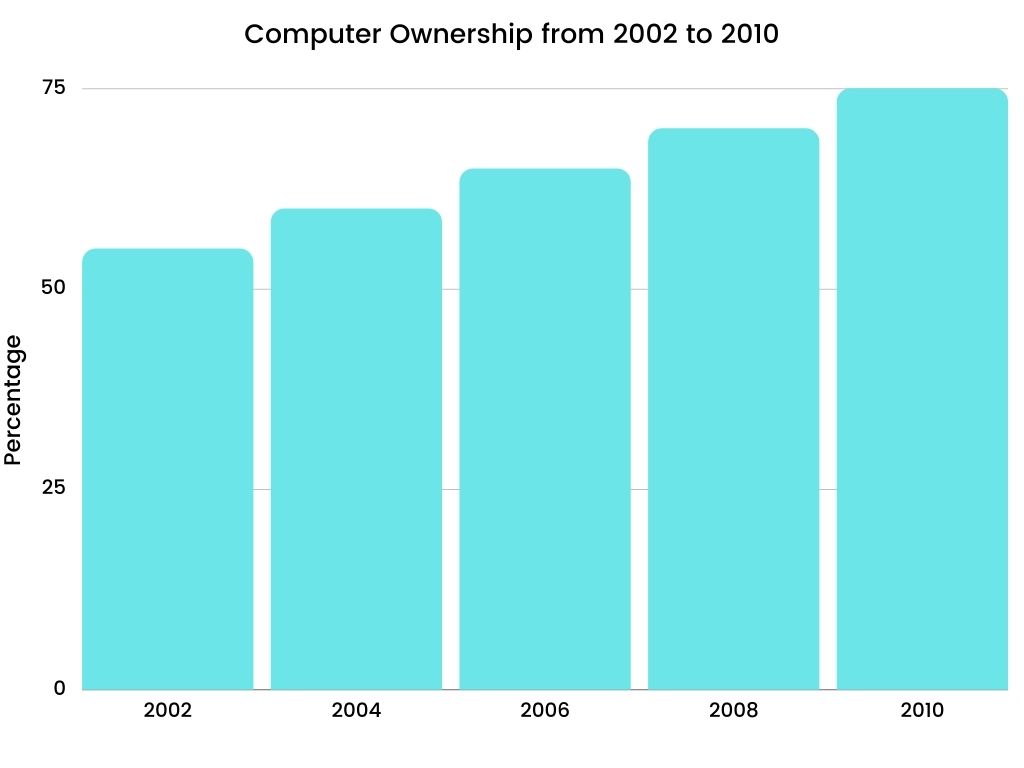
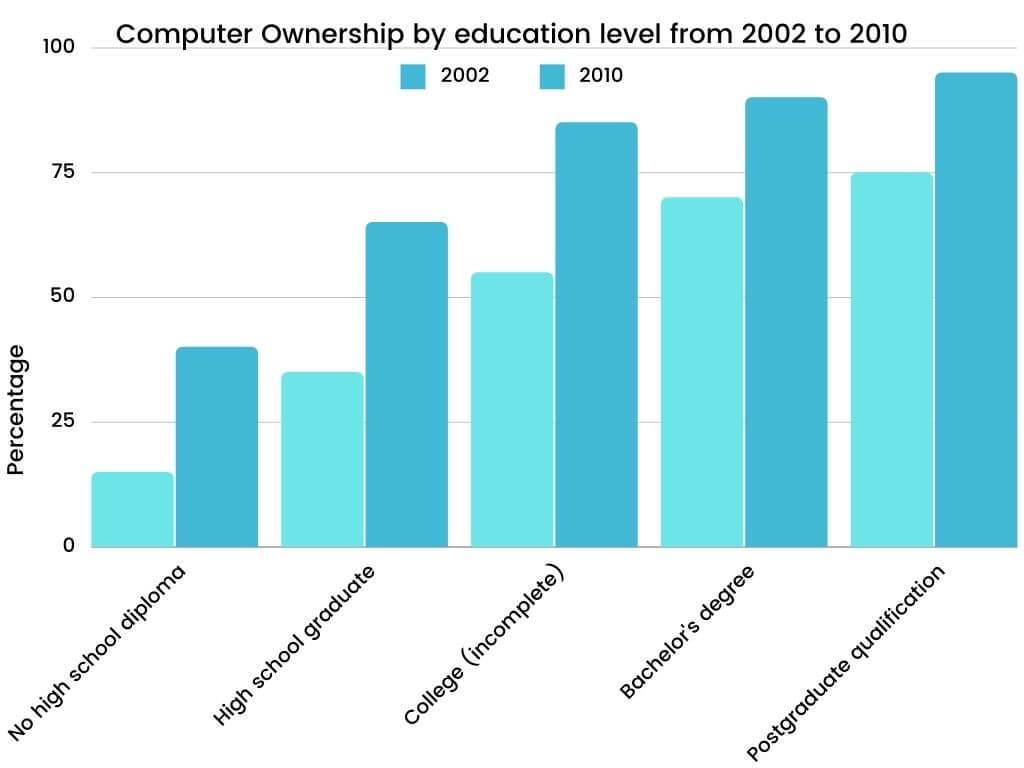
The graphs below give information about computer ownership as a percentage of the population between 2002 and 2010, and by level of education for the years 2002 and 2010. Summarise the information by selecting and reporting the main features, and make comparisons where relevant.
Write at least 150 words.
Outline to Frame Your Answer for IELTS Bar Graph
|
Introduction (Paraphrase the Question)
Overview (Summarize Main Trends)
Body Paragraph 1 (Detailed Comparisons – Time-Based or Group-Based)
Body Paragraph 2 (More Details or Group Comparisons)
|
Sample Answers for Information about Computer Ownership as a Percentage of the Population - IELTS Writing Task 1
Below are three IELTS Writing Task 1 sample answers on the topic, Information about Computer Ownership as a Percentage of the Population, that will help you write an answer for an IELTS band score 9.
Information about Computer Ownership as a Percentage of the Population - Sample Answer 1
The bar graph illustrates the percentage of the population that owned computers from 2002 to 2010, with a further breakdown by education level in 2002 and 2010.
Overall, computer ownership increased steadily over the years. Additionally, individuals with higher education levels consistently showed greater computer ownership in both years.
In 2002, just over 50% of the population owned a computer, and this figure rose to around 70% by 2010. In terms of education, those with no high school diploma had the lowest ownership rates, under 40% in 2002, increasing slightly in 2010. Meanwhile, postgraduates had the highest rates in both years, starting at about 80% in 2002 and rising to over 90% in 2010.
While all education groups experienced growth in computer ownership, the gap between lower and higher education levels remained noticeable throughout.
Book a FREE demo to talk to our experts and boost your prep for IELTS Writing now!
Information about Computer Ownership as a Percentage of the Population - Sample Answer 2
The given bar chart represents data associated with computer ownership that is further classified by education level from 2002 to 2010.
A stable but substantial increase is evident in the population percentage that owned computer over the given period. In 2002, only a bit more than half the population had computers, whereas three out of four people had a computer at home in 2010.
A scrutiny of the data by education level demonstrates that higher education levels correspond to higher computer ownership levels in both years. In 2002, only around 15% of the people who didn’t finish high school owned a computer, but this number tripled by 2010. Also, in 2001, for those with a high school diploma or an unfinished college education, there were significant upsurges, of almost 30%, which reached up to 65% and 85% respectively in 2010. However, graduates and postgraduates had the greatest ownership levels in 2010, at 90% and 95%, respectively, 20% higher than 2002.
Boost your IELTS Writing score with expert guidance—join our online webinar now!
Information about Computer Ownership as a Percentage of the Population - Sample Answer 3
The bar chart provides data on the percentage of computer ownership among the general population between 2002 and 2010 and further categorizes ownership by education level for the years 2002 and 2010.
Overall, there was a consistent increase in computer ownership over time, and individuals with higher educational qualifications were significantly more likely to own computers.
In 2002, slightly more than half the population owned computers, and this figure rose steadily, reaching approximately 70% by 2010. The ownership rate increased across all education levels, with the most significant disparity observed between the least and most educated groups.
For example, in 2002, computer ownership among those without a high school diploma was about 15%, whereas for postgraduate qualification holders, it was over 80%. By 2010, ownership had increased across all categories: postgraduates reached almost 95%, while those without a diploma rose to around 40%.
The data clearly illustrates the digital divide based on education, although overall access to computers improved during the period.
Grab Our Extensive Bundle for IELTS Writing (Academic) & Ease Your Writing Worries!
How to Answer Information about Computer Ownership as a Percentage of the Population IELTS Writing Task 1?
Go through the five focused top writing techniques for the IELTS Writing section on how to summarize the important points for the IELTS bar graph topic, Information about Computer Ownership as a Percentage of the Population, effectively, and they will help you craft a high-scoring response.
- Highlight Overall Trends First: Begin your summary by noting the general increase or decrease in ownership. For this topic, mention that computer ownership increased across all groups over the period.
- Use Comparative Language Effectively: Use IELTS Writing Task 1 connectors and vocabulary, like ‘higher than’, ‘lower than’, ‘significantly more’, ‘almost double’ to compare different education levels or years.
- Group Similar Data Together: When discussing education levels, group those with similar ownership rates (e.g., postgraduates and bachelor’s degree holders) to avoid repeating ideas.
- Avoid Personal Opinions: Stick to describing the data. Don’t mention why people might own more computers or speculate on causes unless the graph provides such information.
- Practice Using Percentages and Time References: Accurately describing changes over time is key. Use phrases like ‘increased from X% to Y%, rose steadily between 2002 and 2010, or ownership climbed by around 20 percentage points’.
To sum up, IELTS bar graphs, like ‘Information about Computer Ownership as a Percentage of the Population’, test your ability to read and interpret numerical data and trends effectively. Focus on making clear comparisons, organizing your response logically, and using precise academic vocabulary. Practicing with recent IELTS Writing Task 1 topics academic with model answers like the ones above, will help you become more confident and efficient in tackling IELTS Writing Task 1 questions.
Useful Links:
- Percentage of People Living Alone in 5 Different Age Groups in the USA - IELTS Academic Writing Task 1 (Bar Chart)
- IELTS Academic Writing Task 1 Topic 43: Number of overseas students enrolled - Bar chart
- IELTS Academic Writing Task 1 Topic 06: Global population percentages and distribution of wealth - Bar Chart
- Vocabulary for Accurate Data in Writing Task 1
- Coherence and Cohesion in IELTS Writing
- Cohesive Devices in IELTS Writing: Meaning, Examples & List
Practice IELTS Writing Task 1 based on report types

Start Preparing for IELTS: Get Your 10-Day Study Plan Today!

Explore other Writing Task 1 Articles

Kasturika Samanta


Nehasri Ravishenbagam
Recent Articles

Nehasri Ravishenbagam


Nehasri Ravishenbagam

Kasturika Samanta


Post your Comments
2 Comments