Survey Conducted by a University Library - IELTS Academic Writing Task 1
6 min read
Updated On
-
Copy link
Learn how to describe IELTS Academic Writing Task 1 pie charts, like ‘Survey Conducted by a University Library’, along with mastering vocabulary and structure to improve your band score with our expert tips in this blog post, and be IELTS-ready.

Table of Contents

Effective IELTS Essay Connectors for Writing Task 2 & Task 1
Understanding how to report an IELTS Task 1 pie chart, ‘Survey Conducted by a University Library’ in IELTS Writing is essential for scoring Band 8 or above. Use precise vocabulary, follow a logical structure, and always keep your descriptions objective and data-driven. With practice and the strategies shared in this post, you’ll be well on your way to mastering this task type.
In this blog, we will explore 3 sample answers, along with useful tips and vocabulary to describe a graph or chart for a high-scoring response.
Question for Survey Conducted by a University Library - IELTS Writing Task 1
You should spend about 20 minutes on this task.
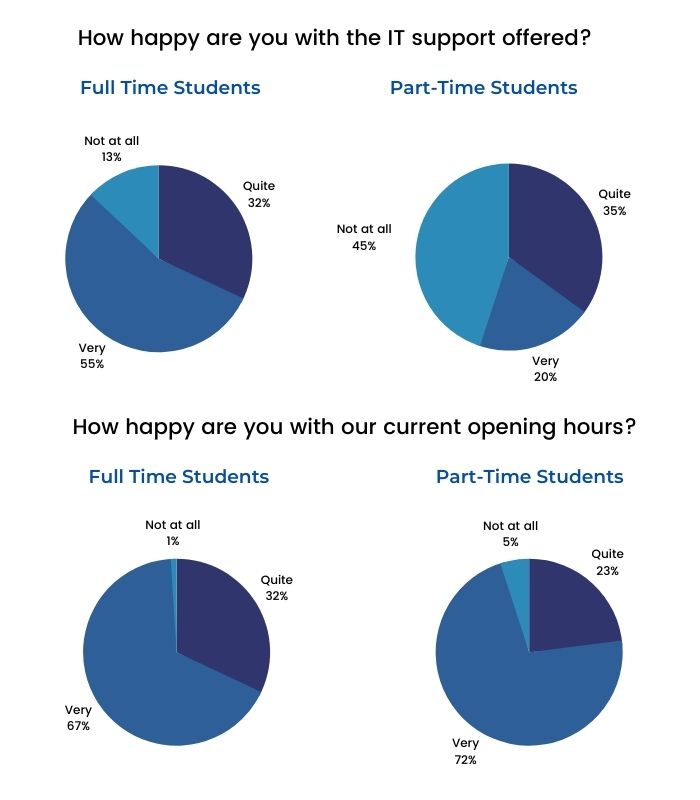
The charts below show the results of a survey conducted by a university library to find out the opinions of full-time and part-time students about its services. Summarise the information by selecting and reporting the main features, and make comparisons where relevant.
Write at least 150 words.
Outline to Frame Your Answer for IELTS Pie Chart
|
Introduction (1–2 sentences)
Overview (1–2 sentences)
Body Paragraph 1: IT Support and Book Resources (3–4 sentences)
Body Paragraph 2: Opening Hours (2–3 sentences)
Concluding Statement (Optional)
|
Sample Answers for Survey Conducted by a University Library - IELTS Writing Task 1
We have listed three sample responses for IELTS Writing Task 1 related to the topic, Survey Conducted by a University Library. Using them will help you write a band score 9 answer.
Survey Conducted by a University Library - Sample Answer 1
The pie charts compare the opinions of full-time and part-time students about their university services, including IT Support and library opening hours.
We can observe from the pie-charts that the full-time students tend to be more satisfied with the two services than their part-time counterparts. But, both full-time and part-time students gave positive feedback about the library opening hours.
Regarding IT Support, 55% of the total full-time students and only 20% part-time students were delighted. While 32% and 35% of the full-time and part-time students were quite happy with this service, 13% of the full-time students and 45% of the part-time counterparts were not satisfied at all.
In terms of opening hours, the majority of the full-time and part-time students were delighted. The former accounted for 67% while the latter made up to 72% respectively. Around 23% of the part-time students and 32% of the full-time counterparts were quite happy with these hours. Besides, the proportion of the students who were dissatisfied in both groups was significantly less, at 1% and 5%.
Boost your IELTS Writing score with expert guidance—join our online webinar now!
Survey Conducted by a University Library - Sample Answer 2
The two bar charts illustrate the opinions of full-time and part-time students about three university library services: IT support, library opening hours, and the quality of book resources. The survey measured responses in three categories: ‘Very Good’, ‘Quite Good’, and ‘Not at all Good’.
Overall, both student groups rated IT support the most favorably, although full-time students gave more positive feedback. Opinions about opening hours differed significantly, with part-time students expressing greater satisfaction.
For IT support, 65% of full-time students rated it as ‘Very Good’, compared to only 35% of part-time students. Regarding book resources, around 50% of full-time students marked it as ‘Quite Good’, while part-time students were more critical, with higher percentages selecting ‘Not at all Good’. In contrast, over 70% of part-time students rated library opening hours as ‘Very Good’, whereas only 50% of full-time students did so.
These results indicate a contrast in service satisfaction, with part-time students especially valuing extended hours, while full-time students prioritized IT services.
Grab Our Extensive Bundle for IELTS Writing (Academic) & Ease Your Writing Worries!
Survey Conducted by a University Library - Sample Answer 3
The bar charts present the results of a survey conducted by a university library to assess full-time and part-time students' satisfaction with three core services: IT support, library opening hours, and book resources. Responses were categorized into ‘Very Good’, ‘Quite Good’, and ‘Not at all Good’.
Overall, full-time students gave the highest approval to IT support, whereas part-time students were more impressed with library opening hours. Book resources received a more mixed response from both groups, though full-time students rated them more positively.
IT support was rated ‘Very Good’ by 65% of full-time students, compared to just 35% of their part-time counterparts. In terms of book resources, full-time students’ feedback leaned toward ‘Quite Good’ and ‘Very Good’, while part-time students had a higher proportion of ‘Not at all Good’ responses. Interestingly, over 70% of part-time students marked library opening hours as ‘Very Good’, significantly higher than the 50% among full-time students.
The survey clearly highlights differing priorities: full-time students value technical and academic support, while part-time learners emphasize accessibility and convenience.
How to Answer Survey Conducted by a University Library IELTS Writing Task 1?
As you describe pie chart-based questions in IELTS Writing Task 1, such as 'Survey Conducted by a University Library', you need to compare the pie charts over time, highlighting changes as they occurred over time. Below are five top writing techniques for the IELTS Writing section on how to answer this task effectively.
- Identify what is being compared: Focus on who took the survey (e.g., full-time vs part-time students) and what features are rated (e.g., IT support, hours, books).
- Pay attention to rating categories: Describe how ratings (e.g., Very Good, Good, Not Good) are distributed across different services and groups.
- Group and compare logically: Instead of describing every category separately, compare responses across student types for each service.
- Use comparative and contrastive language: Use expressions and IELTS Writing Task 1 connectors, like ‘in contrast’, ‘whereas’, ‘higher than’, ‘more positively’, ‘less satisfied’ to make clear comparisons.
- Avoid personal opinions: Focus on the data only. Do not speculate why students felt a certain way unless it's very clear and factual.
In summary, we hope you have learned how to write an analytical paragraph about Survey Conducted by a University Library in 100-150 words by selecting and reporting the main features, and comparing them where needed. Also, make sure to take up more IELTS Writing practice tests and be prepared to score band 8+ in IELTS Writing.
Useful Links:
- Main Methods of Transportation for People Traveling to a University - IELTS Pie Chart
- Percentage of Water Used for Different Purposes in Six Areas of the World- IELTS Pie Chart
- Use of Public Libraries in 1991 and 2000 in Britain - IELTS Academic Writing Task 1
- Recent IELTS Writing Task 1 Topics Academic with Model Answers
- 50+ Recent IELTS Writing Topics with Answers: Essays & Letters
- 21+ Tips On How to Improve Your IELTS Writing Band Score
Practice IELTS Writing Task 1 based on report types

Proven tips to score Band 9 in IELTS Writing

Explore other Writing Task 1 Articles
Kasturika Samanta


Nehasri Ravishenbagam
Recent Articles

Nehasri Ravishenbagam


Nehasri Ravishenbagam

Kasturika Samanta


Post your Comments