The Changes In Ownership Of Electrical Appliances And Amount Of Time Spent - IELTS Writing Task 1
6 min read
Updated On
-
Copy link
Learn how to describe IELTS line graphs effectively with 3 sample answers on ‘The Changes in Ownership of Electrical Appliances and Housework Time’. Perfect for Band 7–9 preparation!
Table of Contents
- Question
- Structure Breakdown
- The Changes In Ownership Of Electrical Appliances And Amount Of Time Spent - Sample Answer 1
- The Changes In Ownership Of Electrical Appliances And Amount Of Time Spent - Sample Answer 3
- The Changes In Ownership Of Electrical Appliances And Amount Of Time Spent - Connectors Used

Try AI Essay Checker for Instant Band Score
In the IELTS Academic Writing Task 1, you are required to describe visual information, such as graphs, charts, or diagrams. One such example is the line graph titled ‘The Changes in Ownership of Electrical Appliances and Amount of Time Spent Doing Housework in Households’, which you must analyse and report on in a formal style.
IELTS Writing Task 1 Line Graph are commonly featured in the IELTS exam and are used to show changes over time. They typically have two axes: the X-axis, which indicates the time period, and the Y-axis, which shows the quantity or percentage being measured. These graphs help highlight trends and patterns—such as increases, decreases, or stability—in the data. Let’s explore this specific line graph with three expert-crafted sample answers, demonstrating responses at different proficiency levels, including Band 7 to Band 9.
Before Diving into the Given IELTS Writing Task 1 Line Graph, Learn a Bit More About Line Graph Vocabulary!
Question
The charts below show the changes in ownership of electrical appliances and amount of time spent doing housework in households in one country between 1920 and 2019.
Summarise the information by selecting and reporting the main features, and make comparisons where relevant.
Write at least 150 words.
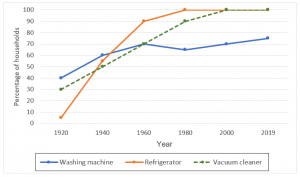
Percentage of households with electrical appliances (1920-2019)
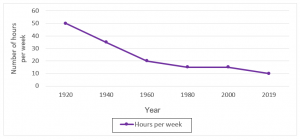
Number of hours of housework* per week, per household (1920 – 2019)
Structure Breakdown
|
The Changes In Ownership Of Electrical Appliances And Amount Of Time Spent - Sample Answer 1
The provided line graphs depict changes in household appliance ownership and housework duration in a specific country from 1920 to 2019. Overall it is apparent that there is a significant rise in appliance ownership, accompanied by a notable decrease in time spent on housework.
Looking at the first graph, refrigerators were rarely used in 1920, and they saw a sharp increase since 1930. Moreover, by the year 1980, the ownership of fridges was by every household. Regarding Vacuum cleaner ownership, it was owned by nearly 3 out of 10 houses a century ago but now is present in almost all families. Considering the washing machine, the usage of it has also increased significantly, reaching slightly over 70%.
The second graph highlights a clear link between appliance ownership and reduced housework time. The average number of hours spent doing household chores dropped significantly from 50 hours per week in 1920 to only 10 hours per week in 2019. (157 Words)
Ready to grab the latest IELTS writing task 1 ebook? Buy now!
The Changes In Ownership Of Electrical Appliances And Amount Of Time Spent - Sample Answer 1
The provided charts illustrate the shifts in appliance ownership and the corresponding time devoted to housework in households within a particular country from 1920 to 2019. An overview is that the charts show that the ownership of electrical appliances has increased, and the amount of time spent on housework has decreased substantially.
The first chart depicts the percentage of households possessing various appliances like washing machines, refrigerators, and vacuum cleaners. In 1920, ownership of these appliances was minimal, with fewer than 10% of households having them. However, by 2019, almost all households possessed washing machines and refrigerators, while over 80% owned vacuum cleaners.
The second chart showcases the average time allocated to housework per week. It is also interesting to note that, with the increasing number of electric appliances owned by families, their need for doing household work like preparing meals, cleaning and washing clothes remarkably diminished. In 1920, households expended over 30 hours weekly on housework, a figure that diminished to just under 20 hours by 2019. (168 Words)
Struggling to Crack the IELTS Writing Task 1? Our 8+ band trainers have got you! Sign up for a FREE demo now!
The Changes In Ownership Of Electrical Appliances And Amount Of Time Spent - Sample Answer 3
The given line graphs illustrate the data on the ownership of household devices along with the duration of housework done by people in the family in a nation between the years 1920 and 2019.
Overall, the ownership of the machines had clearly increased since the beginning, with vacuum cleaners and refrigerators being owned by all the families.
Regarding the first graph, refrigerators were a rare item in households in the year 1920, but their presence also increased then. Since 1980, all families in this country had this machine in their households and a similar but much smoother trend can be observed with vacuum cleaners as well. A century ago, most of the houses had the machine but now it is almost in every other home. Lastly, washing machines were owned by 40% of the people in 1920 and reached 70% in just four decades.
The second line graph shows a direct correlation between the ownership of essential household items and the amount of work required to be done at home. Furthermore, the household work percentage dropped directly from a high 50 hours per week in 1920 to a mere 10 hours per week in 2019. (197 Words)
Curious about your IELTS Writing score? Submit your IELTS Writing Essay for evaluation & get improvement tips!
The Changes In Ownership Of Electrical Appliances And Amount Of Time Spent - Connectors Used
Connectors, also known as connectives or transition words, are words or phrases that link ideas or parts of a sentence or paragraph together. Here are some of the connectors used in the above sample answers:
- Looking at the first graph
- Moreover
- Regarding
- Considering
- Second graph highlights
- However
- It is also interesting to note that
- Since
- Lastly
- Furthermore
Boost your IELTS Writing Task 1 score & learn how to write standout essays. Sign up for an expert session today!
By studying these sample answers, you’ll gain a clearer understanding of how to describe trends, compare data effectively, and use appropriate vocabulary and structure for IELTS Writing Task 1. Remember to proofread your essay for grammar, vocabulary, and spelling errors. These tips, combined with practice, will help you write well-structured and coherent IELTS Writing Task 1 Line graph answers like ‘The Changes In Ownership Of Electrical Appliances And Amount Of Time Spent Doing Housework In Households,’ and achieve your desired IELTS Band Score.
Useful Links:
- IELTS Academic Writing Task 1 Topic 38: Paris Metro station passengers – Line Graph
- Information about the rates of unemployment | Line Graph – IELTS Academic Writing Task 1 Practice Test 34
- IELTS Writing Practice Test 30 (Task 1 & 2) & Sample Answers
- IELTS Academic Writing Task 1 Topic : Price changes for fresh fruits and vegetables – Line Graph
- IELTS Academic Writing Task 1 Topic : International conferences in three capital cities – Line Graph
Practice IELTS Writing Task 1 based on report types

Start Preparing for IELTS: Get Your 10-Day Study Plan Today!

Explore other sample Line Graphs


Recent Articles

Nehasri Ravishenbagam


Nehasri Ravishenbagam

Kasturika Samanta


Post your Comments