Weekday Volume of Passenger Activity on the Toronto Metro System - IELTS Writing Task 1 (Line Graph)
7 min read
Updated On
-
Copy link
Study the outline and sample answers for ‘The graph below shows the weekday volume of passenger activity on the Toronto metro system’ in this blog. They will guide you to improve your writing score on IELTS Writing Task 1 & approach them with confidence.
Table of Contents
- Question for Weekday Volume of Passenger Activity on the Toronto Metro System - IELTS Academic Writing Task 1
- Outline for IELTS Writing Task 1 Line Chart
- Sample Answers on ‘Weekday Volume of Passenger Activity on the Toronto Metro System'
- Tips for IELTS Writing Task 1 Line Graph - Weekday Volume of Passenger Activity on the Toronto Metro System

Try AI Essay Checker for Instant Band Score
Urban transportation systems often experience predictable fluctuations in passenger demand during a typical working day. The line graph ‘The graph below shows the weekday volume of passenger activity on the Toronto metro system’ highlights how commuter traffic rises and falls at different times, particularly during rush hours. To achieve a Band 8+ score in IELTS Academic Writing Task 1, you must identify these peak travel periods and explain the overall daily pattern using clear comparisons and accurate trend vocabulary.
In this blog, we will look at how to structure a question based on a line graph, three sample answers to 'Weekday Volume of Passenger Activity on the Toronto Metro System', and IELTS line graph writing tips.
Question for Weekday Volume of Passenger Activity on the Toronto Metro System - IELTS Academic Writing Task 1
You should spend about 20 minutes on this task
The graph below shows the weekday volume of passenger activity on the Toronto Metro system for July 2007.
Summarize the information by selecting and reporting the main features, and make comparisons where relevant.
You should write at least 150 words.
Outline for IELTS Writing Task 1 Line Chart
Given below is a detailed structure that will assist you in organizing your answer for IELTS Writing Task 1 - Line Graph, like ‘The graph below shows the weekday volume of passenger activity on the Toronto metro system’.
|
Introduction
Overview
Body Paragraph 1
Body Paragraph 2
|
Sample Answers on ‘Weekday Volume of Passenger Activity on the Toronto Metro System'
Now, take a look at the sample answers for ‘The graph below shows the weekday volume of passenger activity on the Toronto metro system' for various IELTS band scores, which will help you frame your responses clearly.
Weekday Volume of Passenger Activity on the Toronto Metro System - Sample Answer 1
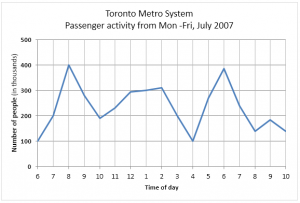
The line graph illustrates the number of people that use the Toronto metro system at different times of day for the month of July 2007.
Overall, metro usage rises sharply in the early morning before reaching a peak at around 8:00. After a decline during the late morning, passenger numbers increase again in the late afternoon, creating a second peak before falling in the evening.
At the beginning of the day, around 6:00, approximately 100 thousand passengers use the metro. This figure increases dramatically to reach about 400 thousand at 8:00, which is the highest level recorded on the graph. However, the number then decreases rapidly to around 200 thousand by 10:00.
During the midday period, passenger numbers remain relatively stable. In the afternoon, they begin to rise again, reaching close to 380 thousand at about 18:00. After this evening rush hour, metro activity gradually declines for the remainder of the day.
Book free IELTS online classes to discuss your writing queries with our IELTS expert!
Weekday Volume of Passenger Activity on the Toronto Metro System - Sample Answer 2
The line graph illustrates the number of passengers using the Toronto Metro system during a typical weekday in July 2007. The figures are given in thousands and show fluctuations in passenger activity throughout the day.
Overall, passenger numbers vary considerably during the day, with two clear peak periods corresponding to morning and evening commuting hours. The highest level of metro usage occurs in the morning, while activity declines later in the evening.
At 6:00, the number of passengers stands at around 100 thousand. This figure rises sharply over the next two hours, reaching a peak of approximately 400 thousand at 8:00, which represents the busiest time of the day. Following this peak, metro usage drops significantly to roughly 200 thousand by 10:00.
During the middle of the day, passenger numbers remain relatively stable, fluctuating slightly around the 250 thousand mark. In the afternoon, usage begins to increase again as commuters return home, reaching a second peak of around 380 thousand at approximately 18:00. After this point, the number of passengers declines steadily, falling to below 150 thousand by the late evening.
Book a FREE Demo to learn tips and writing techniques for Academic Task 1 from experts!
Weekday Volume of Passenger Activity on the Toronto Metro System - Sample Answer 3
The line graph presents information about the number of passengers using the Toronto Metro system during a typical weekday in July 2007, with figures expressed in thousands.
Overall, metro usage follows a clear daily commuting pattern characterised by two prominent peaks. Passenger activity rises sharply in the early morning to reach the highest level of the day, before declining and then increasing again during the evening rush hour.
Passenger numbers begin at around 100 thousand at 6:00 and increase dramatically over the next two hours. By 8:00, metro usage reaches a peak of approximately 400 thousand passengers. However, this surge is followed by a rapid fall, with numbers dropping to roughly 200 thousand by 10:00.
During the middle of the day, passenger activity stabilises at around 250 thousand. In the late afternoon, numbers begin to climb again as commuters travel home from work. This results in a second peak of nearly 380 thousand at about 18:00, after which passenger volume declines steadily toward the end of the day.
Want extensive materials to get ready for the IELTS Academic Writing Task 1?
Check out IELTS Writing Task 1 (Academic) Actual Tests with Answers!
Tips for IELTS Writing Task 1 Line Graph - Weekday Volume of Passenger Activity on the Toronto Metro System
Let us check out some useful tips and vocabulary to describe a graph or chart in IELTS Academic Writing Task 1 that will help you achieve a Band 9 score on ‘The graph below shows the weekday volume of passenger activity on the Toronto metro system’ line graph.
- Identify the two rush hours: The graph mainly reflects commuting patterns, so identifying the morning and evening rush hours helps summarise the key trends. So, clearly mentioning these peaks in the overview shows that you understand the main feature of the data.
- Highlight the Highest Point: The morning peak of around 400 thousand passengers represents the highest value on the graph and is a crucial feature to mention. IELTS examiners expect you to identify extreme points, such as the highest and lowest figures, to demonstrate strong task achievement.
- Describe patterns, not just numbers: Instead of simply listing numbers, focus on how the values change over time. Describing trends with phrases like ‘rose sharply’ or ‘fell dramatically’ makes your answer more analytical and improves coherence.
- Use time expressions correctly: Using natural time phrases such as ‘in the early morning’, ‘by midday’, or ‘towards the evening’ helps connect ideas smoothly. These expressions improve the flow of the report and make the description easier to follow.
- Use strong trend vocabulary: Precise verbs like ‘surged’, ‘climbed sharply’, ‘declined gradually’, and ‘stabilised’ help describe changes more accurately. Using varied and appropriate vocabulary can significantly improve the lexical resource score.
- Divide the body paragraphs by time period: Organising the report by time periods (morning vs. midday/evening) makes the answer clearer and more structured. This logical organisation improves coherence and readability in Task 1 responses.
To conclude, successfully describing this type of line graph requires identifying peak periods, explaining fluctuations clearly, and organising information chronologically. By focusing on key trends rather than excessive numbers and using precise academic vocabulary, you can produce a well-structured response capable of achieving a Band 8+ score in IELTS Writing Task 1. So, start practicing recent IELTS Writing Task 1 topics academic with model answers and improve your writing skills.
Useful Links:
- The graph below gives information from a 2008 report about the consumption of energy - IELTS Writing Task 1
- The Percentage of Female Members of Parliament in 5 European Countries - IELTS Academic Writing Task 1 (Line Graph)
- IELTS Academic Writing Task 1 Topic : Price changes for fresh fruits and vegetables - Line Graph
- The Changes In Ownership Of Electrical Appliances And Amount Of Time Spent Doing Housework In Households - IELTS Writing Task 1
- IELTS Writing Task 1 Line Graph Vocabulary
- Get IELTS Band 9 In Writing Task 1 Data Charts and Graphs (eBook)
Practice IELTS Writing Task 1 based on report types

Start Preparing for IELTS: Get Your 10-Day Study Plan Today!

Explore other sample Line Graphs


Nehasri Ravishenbagam
Recent Articles

Nehasri Ravishenbagam


Nehasri Ravishenbagam

Kasturika Samanta


Post your Comments