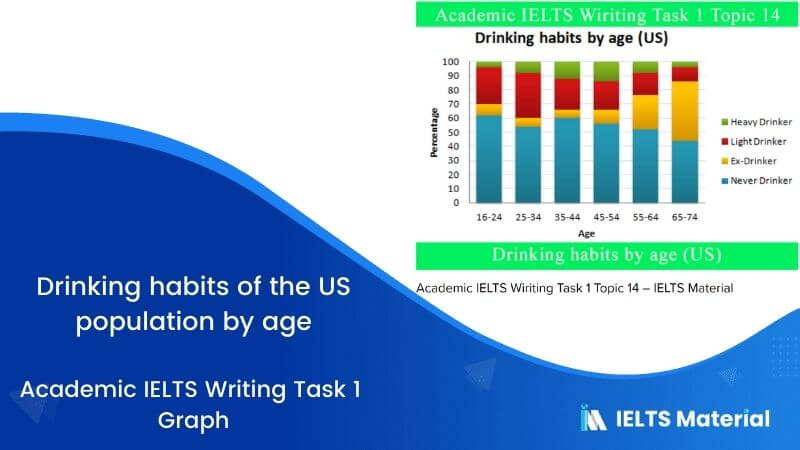
IELTS Academic Writing Task 1 Topic 14: Drinking habits of the US population by age – Graph

Limited-Time Offer : Access a FREE 10-Day IELTS Study Plan!
The graph gives information about drinking habits of the US population by age.
Summarise the information by selecting and reporting the main features, and make comparisons where relevant.
Write at least 150 words.
Report Plan
Paraphrase: gives information>outlines; drinking habits of the US population by age>the drinking pattern of Americans based on their age groups
Overview: The bar graph outlines the drinking pattern of Americans based on their age groups.
Paragraph 2: (1) compare drinking patterns in different age groups. Give figures.
Paragraph 3: (1) compare drinking patterns in remaining age groups. Give figures.
Paragraph 4: (1) talk about the age group with highest drinking pattern. Give figures.
Sample Answer
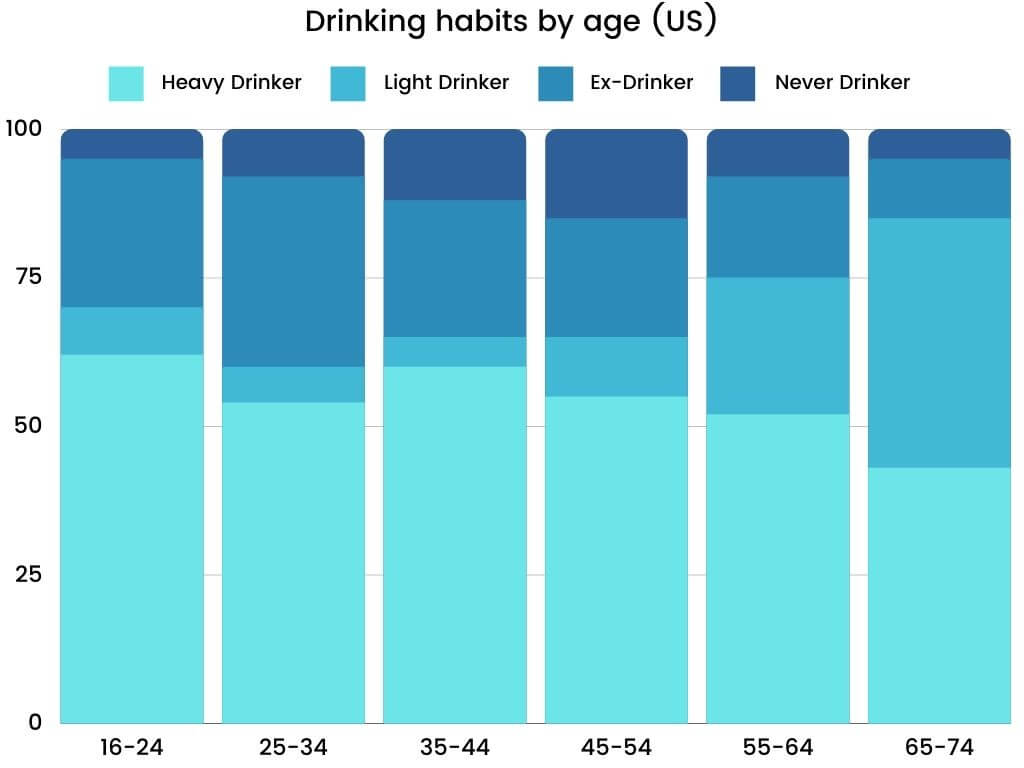
The given bar graph outlines the drinking pattern of Americans based on their age groups. As evident, the drinking habits of US citizens markedly vary based on their age groups. It is seen that the elderly population, majorly those who are above 65 years of age, generally abstain from this addiction.
As per the diagram, 60% of Americans between 16 to 24 years of age have never drunk, while about 10% of them used to drink but now abstain from it. Approximately one-quarter of these youngsters are light-drinkers, and the remaining 5% are heavy on the alcohol. An indistinguishable pattern can be discerned among the age group of 25-34 years. However, the ratio of irregular drinkers has increased, and nearly 8% are hard drinkers.
It is also interesting to note that chronic alcoholics in the country cover the age group of 35-54 years and this ratio is seemingly lower among senior and younger citizens. With an increase in age, the rate of people who never had alcohol declines considerably. Also, a reverse trend can be observed for the ex-drinkers, whose number goes higher as people get older.
The highest ratio of those who are hard drinkers falls between the age group of 45-54 years. On the other hand, the light drinkers cover the highest among the age group of 25-34 years of US citizens. At last, an enormous number of Americans, which is almost 40%, have quit drinking once past 64 years of age.
Get evaluated for FREE!
Got a quick report in your mind for this question. Don’t hesitate to post the same in our comment section. We will evaluate the report/letter and email you the band score & our trainer’s comments. And, this service is entirely free.
Also check:
Practice IELTS Writing Task 1 based on report types

Start Preparing for IELTS: Get Your 10-Day Study Plan Today!

Explore other sample Bar Charts


Recent Articles
Nehasri Ravishenbagam


Nehasri Ravishenbagam


Post your Comments
1 Comment
Asad Ali
Posted on Apr 9, 2022
The following bar graph encompasses the drinking habits, heavy, light, ex and non-drinkers, of the United States which are categorized by age.
A recurring pattern can be observed in the age range of 16-64 where the majority of the individuals are heavy drinkers. This ratio comprises of more than 50% of the individuals in the above mentioned age ranges. This pattern can not be seen in the age range of 65-74 where majority of the individuals are those who indulge in light drinking.
It can also be observed that a low ratio of light drinkers is evident in the age ranges of 16 to 54, similarly, another low ratio have been observed in the category of ex drinker in all age range except for the range of 45-54.
In conclusion, we can say that most of the population of America indulges in heavy drinking and that this pattern continues to persist until a certain age.
Reply