Different Sources of Air Pollutants in the UK - IELTS Academic Writing Task 1 Line Graph
7 min read
Updated On
-
Copy link
Want to know how to identify trends, compare data, and write a structured answer? Gain insights into the tricks for IELTS Academic Writing Task 1 Line graph on ‘Different Sources of Air Pollutants in the UK’ along with band 7, 8, and 9 sample answers.
Table of Contents
- How to Attempt the Line Graph on ‘Different Sources of Air Pollutants in the UK’?
- Structure Breakdown for IELTS Academic Writing Task 1 Topic ‘Different Sources of Air Pollutants in the UK’
- Band 7 Sample Answer for IELTS Academic Writing Task 1 on ‘Different Sources of Air Pollutants in the UK’
- Band 8 Sample Answer for IELTS Academic Writing Task 1 on ‘Different Sources of Air Pollutants in the UK’
- Band 9 Sample Answer for IELTS Academic Writing Task 1 on ‘Different Sources of Air Pollutants in the UK’

Try AI Essay Checker for Instant Band Score
The IELTS Academic Writing Task 1 topic, ‘Different Sources of Air Pollutants in the UK’, would help you to describe, explain, and compare the trends given in the line graph. You need to write your analysis systematically within 20 minutes. Even though the sample answers are provided, you must first try answering the questions yourself first.
It is vital to incorporate a few tricks as you prepare yourself with the line graph from the IELTS Academic Writing Task 1. As you will encounter a visual representation, you must know how to discuss the precise data across different categories or time periods. By practising different topics consistently, you will develop critical thinking and analytical skills.
Connect with our IELTS Experts to crack your IELTS Writing Section and achieve a band 8+! Book a Free Demo.
How to Attempt the Line Graph on ‘Different Sources of Air Pollutants in the UK’?
As you prepare yourself to answer the IELTS Writing Task 1 - Line Graph, you need to first understand how to approach such questions. Since time is limited, you must use a few strategies to elevate your writing preparation. Below are some of the tricks which will enhance your skills and make you confident in answering the questions.
- At first, you must get familiar with the structure to be followed so that the ideas are logically arranged. You must start with paraphrasing the question, followed by an overview of the trends and the analysis as well as comparison of the data in the two paragraphs.
- Keep 5 minutes in the beginning to analyze the data and note them down. You need to check how the information is presented, in which time frame, and notice if there is a pattern. This will guide you to organize the information effectively in four paragraphs.
- Get familiar with the IELTS Writing Task 1 Connectors so that the paragraphs are not abrupt. There should be a smooth transition in between paragraphs as well as sentences.
- Do not provide any personal opinions or experiences in this task which would affect your band scores as well. Always write information which has been presented to you in the question.
- Keep around 3-5 minutes towards the end so that you can always look at your answers. This will help you to identify the mistakes in data analysis, grammar, and spellings which you can rectify.
- Use different sentence structures as you write your answers for which you must learn the main topics from IELTS Grammar.
- Remember to use the appropriate tense and use that in the entire answer. It is suggested not to fluctuate which might affect your band scores in the parameter of grammatical range and accuracy.
- Prepare yourself by attempting the line graph questions so that you can develop the skills for writing. Also, learn how you can use the IELTS Writing Task 1 Line Graph Vocabulary words in your answers.
Curious to know the IELTS Writing Task 1 Line Graph Vocabulary words? Look at the video below and level up your preparation.
Question on the IELTS Academic Writing Task 1 topic ‘Different Sources of Air Pollutants in the UK’
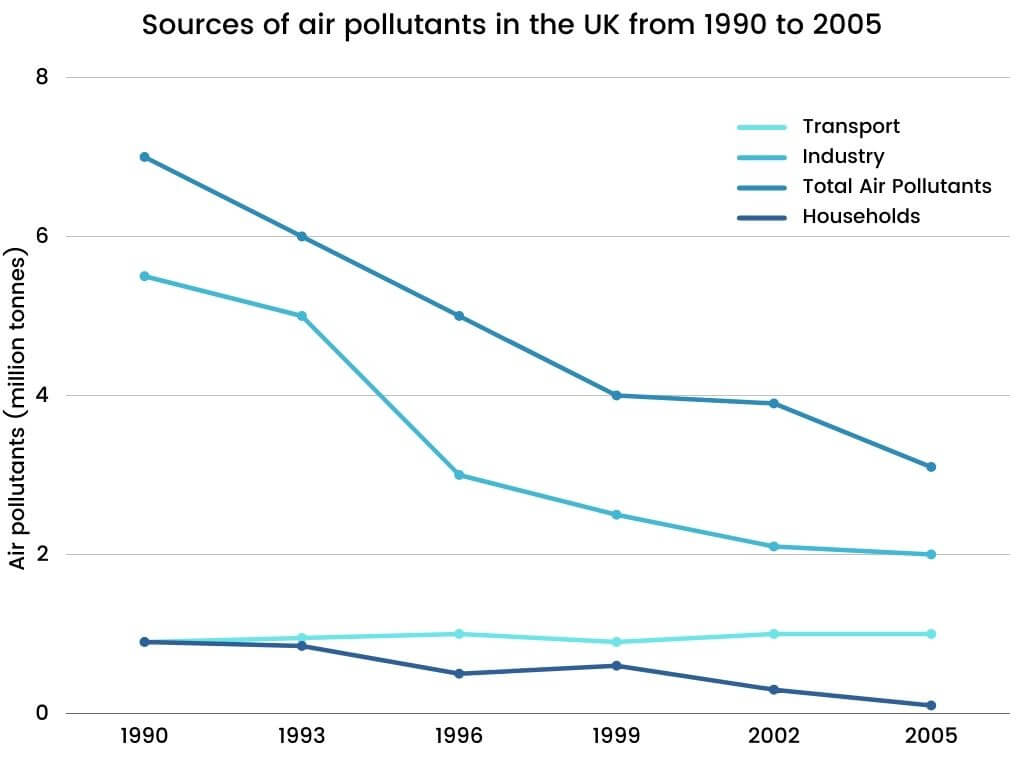
The graph below shows different sources of air pollutants in the UK from 1990 to 2005. Summarise the information by selecting and reporting the main features, and make comparisons where relevant.
Structure Breakdown for IELTS Academic Writing Task 1 Topic ‘Different Sources of Air Pollutants in the UK’
Before you start writing your answer for the Line Graph topic on ‘Different Sources of Air Pollutants in the UK’, you need to organize your points. The structure breakdown would certainly help you to describe the main trends, compare the data, and closely look for relevant changes. It is ideal to make this outline within the first 5 minutes so that you are aware of the way you can present the information in the IELTS Exam. Check out the structure breakdown below which you can use to ideate on the paragraph structure.
|
Type - Line Graph Introductory paragraph:
Summary/overview paragraph:
Paragraph 3:
Paragraph 4:
|
Boost your IELTS Writing score! Buy the Comprehensive IELTS Writing (Academic) Band 8 Preparation Course today & excel in your exams!
Band 7 Sample Answer for IELTS Academic Writing Task 1 on ‘Different Sources of Air Pollutants in the UK’
The line graph provides an insight into the various contributors of air pollution in the United Kingdom from 1990 to 2005.
Overall, in the year 2005, almost all sources of pollution for the last 15 years show a decrease, with the exception of transport.
To begin with, the total pollution appears to show a decline for over a decade, beginning with 7 million tonnes in 1991. Similarly, the industrial sector also showed a decrease, beginning with a data greater than 6 tonnes in 1991 and dropping to 2 tonnes by the year 2005. Finally, the household sector started with slightly over 1 tonne in 1991 which was stabilized until the year 1993, but then experienced fluctuations until reaching zero in 2005.
On the other hand, household transport started together at 1 tonne in 1990. This data experienced a steady growth for the next decade, with no remarkable increases until 2005.
Looking to improve your IELTS Writing skills? Sign up for a free session with our expert instructors today!
Band 8 Sample Answer for IELTS Academic Writing Task 1 on ‘Different Sources of Air Pollutants in the UK’
The line graph indicates the number of emissions released into the air from various sources in the UK between 1990 and 2005.
Overall, the number of air pollutants released by the industry was much higher than other sources. Further, there was a significant fall in the total amount of air pollutants from all the sources.
In the year 1990, around 7 million tonnes of air contaminants were emitted from all the three different sources which significantly dropped to approximately 4 million tonnes in 1999 and then continued to fall to about 3 million tonnes by the end of the period.
The total number of pollutants emitted into the air gradually reduced to about 5 million tonnes by 2005. Further, the industry with the highest amount of contaminants with 5.5 million tonnes in 1990 gradually declined to about 2 million tonnes in 2005. Despite the figures for transport and household emissions being equal at the beginning of the period, there was a slight increase in the number of air pollutants from transport to 1 million tonnes by 2005, while the household emission dropped to a negligible level at 0.1 million tonnes at the end of the period.
Want to get your answer on ‘Different Sources of Air Pollutants in the UK’ assessed? Get Evaluated for FREE!
Band 9 Sample Answer for IELTS Academic Writing Task 1 on ‘Different Sources of Air Pollutants in the UK’
The line graph depicts the various sectors of pollution production in the UK from 1990 to 2005.
In an overview, the contamination levels of air pollutants have shown a decrease over the years, except for the transportation pollution. There was a peak for pollution between the years 1990 and 1995, after which a considerable decline was observed.
The total pollution in the year 1990 was over 6 million tonnes. Factories contributed to the problem, as they accounted for more than 5 million tonnes of pollution, resulting in over 90% of the total contamination sources. Then, in the year 1993, this figure underwent a sharp increase, dropping nearly half of the levels and steadily declining until crossing the 2005 mark.
Furthermore, back in 1990, both household and transportation pollution had negligible figures. Their combined total would only amount to 1 million tonnes. Both have shown some minor changes during the period but on the whole, they remained very stable until 2005.
Enroll into our Free IELTS Webinar and learn more about techniques to improve your IELTS skills to achieve a band 8+.
To achieve a higher IELTS Band Score, you need to understand visual data, identify key trends, and present them in a clear, logical manner. This skill can be developed by exploring different topics in Writing Task 1 questions. Remember to have a focused preparation tricks in mind so that you can boost your confidence level and improve your performance to achieve a higher band score.
Check More IELTS Academic Writing Task 1
|
IELTS Academic Writing Task 1 Topic: Different sources of air pollutants – Line Graph |
IELTS Academic Writing Task 1 Topic: Price changes for fresh fruits and vegetables – Line Graph |
Also Check:
Practice IELTS Writing Task 1 based on report types

Start Preparing for IELTS: Get Your 10-Day Study Plan Today!

Explore other sample Line Graphs


Recent Articles

Nehasri Ravishenbagam


Nehasri Ravishenbagam

Kasturika Samanta


Post your Comments