IELTS Academic Writing Task 1 – Shops that Closed
7 min read
Updated On
-
Copy link
Want to learn how to answer IELTS Academic Line Graph Questions? Dive into the IELTS Academic Writing Task 1 – Shops that Closed With along with band 7, 8, and 9 ample answer and learn the steps to follow for achieving a band score of 8+.
Table of Contents
- 3 Steps to Use for IELTS Academic Writing Task 1 – Shops that Closed for a Band 8+
- Structure Breakdown - IELTS Academic Writing Task 1 – Shops that Closed
- Band 7 Sample Answer for IELTS Academic Writing Task 1 – Shops that Closed
- Band 8 Sample Answer for IELTS Academic Writing Task 1 – Shops that Closed
- Band 9 Sample Answer for IELTS Academic Writing Task 1 – Shops that Closed
- IELTS Writing Task 1 connectors used in IELTS Academic Writing Task 1 – Shops that Closed

Try AI Essay Checker for Instant Band Score
In the IELTS Academic Writing Task 1, you are often required to interpret and present information from charts, graphs like for the IELTS Academic Writing Task 1 – Shops that Closed. Mastering IELTS Writing Task 1 requires a strategic approach to interpreting data accurately and expressing findings coherently. By systematically analyzing the graph showing the number of closed shops and the number of new shops that opened in one country between 2011 and 2018, you can hone their skills in presenting complex information with clarity and precision.
If you want to perfect your writing skills for Academic Writing Task 1, make sure to practice based on the structure as well as the appropriate vocabulary used. With consistent practice, you will be able to analyze the data given by logically arranging them in a coherent manner. Remember that in this task, you will be assessed based on your ability to identify the trend, compare the data, and present your analysis logically to achieve a band 8+.
Let’s have a look at the IELTS Writing Task 1 - Line Graph with three expert-curated sample answers for different IELTS band scores ranging from band 7-9.
Connect with our IELTS Experts to crack your IELTS Writing Section and achieve a band 8+! Book a Free Demo
3 Steps to Use for IELTS Academic Writing Task 1 – Shops that Closed for a Band 8+
Understanding the structure is crucial in order to achieve a higher IELTS Band Score of 8+. It must be noted that you have only 20 minutes to attempt this part and must only write between 150-180 words. However, there are 3 major steps which you can incorporate as you brainstorm your ideas for IELTS Academic Writing Task 1 – Shops that Closed. The following depicts the 3 steps to use which will guide you with your answer and help you score a higher band score of 8+.
1. STEP 1 : Analyze the data
- Always keep 5 minutes in the beginning to understand what is being provided to you in the question.
- Look at what is being measured, what is the time frame, and if there is any pattern.
- Analyze the change if it is steady or fluctuating and clearly identify the peaks and drops in the line graph.
- Focus on the comparisons which you can make from the data provided.
2. STEP 2 : Follow a Structure
- Familiarize yourself with the structure such as introduction, overview paragraph, and two body paragraphs.
- Remember to not provide any assumptions as you write and only mention what is being provided in the question.
- Get familiar with the IELTS Writing Task 1 Connectors so that you can utilize them to show a logical flow of ideas.
3. STEP 3 : Formal Language & Appropriate Vocabulary
- You must use different sentence structures to show a variety for which you must practice on different topics from IELTS Grammar.
- Use synonyms and do not repeat the same words in your response.
- It is important to use the correct tense and follow the same format throughout the task.
Question - IELTS Academic Writing Task 1 – Shops that Closed
You should spend about 20 minutes on this task.
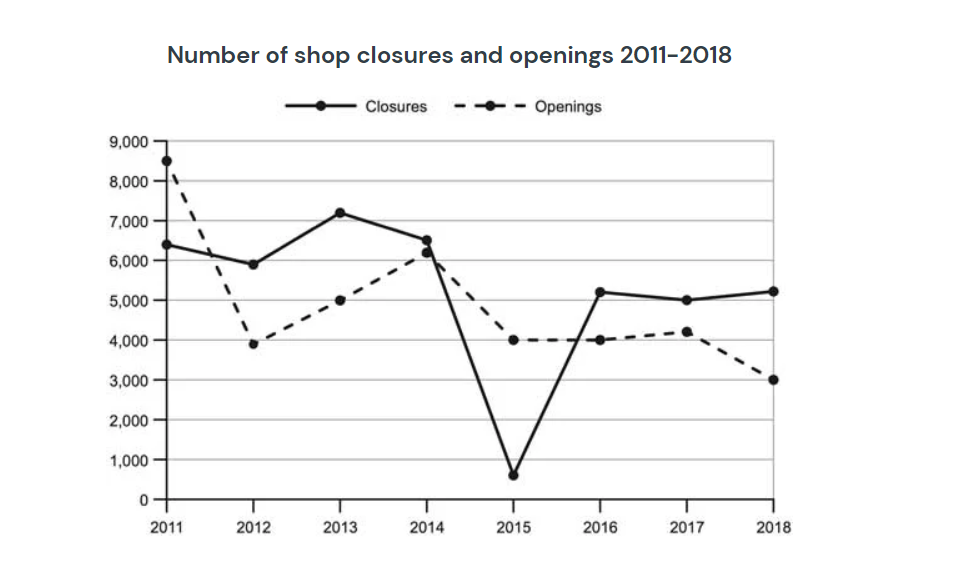
The graph below shows the number of shops that closed and the number of new shops that opened in one country between 2011 and 2018.
Summarise the information by selecting and reporting the main features, and make comparisons where relevant.
Write at least 150 words.

Structure Breakdown - IELTS Academic Writing Task 1 – Shops that Closed
In the IELTS Writing Task 1, you will encounter the bar charts, maps, or line diagrams such as the IELTS Academic Writing Task 1 – Shops that Closed. These are descriptive tasks involving trend description, comparison of data presented, and clearly drawing attention to relevant change. However, you must be able to structure your response well which can help you score Band 8+. The following shows the structure breakdown which you can follow for the IELTS Academic Writing Task 1 – Shops that Closed.
| Type – Line Graph
Introductory Paragraph
Overview
Body Paragraph 1
Body Paragraph 2
|
Looking to improve your IELTS Writing skills? Sign up for a free session with our expert instructors today!
Band 7 Sample Answer for IELTS Academic Writing Task 1 – Shops that Closed
The graph presents the data for a single country from 2011 to 2018, showcasing the openings and closures of shops.
As a whole, shop closures sharply declined in 2015, while shop openings gradually decreased. The correlation between shop openings and closures was evident in the early years, peaking in 2014. However, in subsequent years, the two became increasingly independent of each other.
In 2011, there were over 8,000 shop openings, followed by a notable drop in the subsequent year. From there, a steady increase occurred until 2014. Conversely, shop closures exceeded 6,000 in 2011, peaking at over 7,000 in 2013.
In 2015, about 4,000 shops opened, decreasing over the years to 3,000 in 2018. Shop closures, however, saw a significant drop below 1,000 in 2015, followed by a notable increase to over 5,000 in 2018.
Want a comprehensive guide to get the band score you need in IELTS Writing Task 1? Grab the Comprehensive IELTS Writing (Academic) Band 8 Preparation Course!
Band 8 Sample Answer for IELTS Academic Writing Task 1 – Shops that Closed
The line graph illustrates the opening and closing of shops in a particular nation from 2011 to 2018. Overall, the year 2015 marked the highest number of shop closures, while the minimum number of shop openings occurred at the end of the period. There are fluctuations in shop openings and closures, with 2015 being a significant turning point for closures, and a consistent decline observed in openings towards the end of the period.
To begin with, there were 65,000 shop closures in the initial year, which slightly decreased to 60,000 in 2012. The trend then fluctuated between 2013 and 2014. Notably, there was a significant reduction of around 200 closures in 2018, representing the most substantial change in the given period. Subsequently, minimal variations in shop closures were observed in the following years.
Looking at shop openings, the peak of 85,000 occurred in the first year, followed by a nearly halved count in 2012. Despite some fluctuations, the opening of shops surpassed 6,000 in the subsequent years. However, a considerable drop to 200 openings in 2015 reflected a decline in public preference. In the last two years, a consistent decrease was noted, reaching 3,000 shop openings in 2018.
Want to get your answer on ‘The table and charts below give information on the police budget – IELTS Writing Task 1’ assessed?
Get Evaluated for FREE!
Band 9 Sample Answer for IELTS Academic Writing Task 1 – Shops that Closed
Unlock Answer
The number of store closures oscillated between approximately 6,000 and 7,000 during the initial four years. Subsequently, there was a sharp decline in 2015, reaching a minimum of around 600. Nevertheless, this figure surged to approximately 5,000 in the subsequent year and maintained this level until the end of the observed period.
In 2011, approximately 8,500 stores opened, resulting in a net increase of 2,000. Following a significant drop to 4,000 in 2012, store openings rebounded, nearly matching closure rates in 2014 at slightly over 6,000. This figure then declined again to the 2012 level in 2015, persisting until it further plummeted to an unprecedented low of 3,000 in 2018. (165 words)
IELTS Writing Task 1 connectors used in IELTS Academic Writing Task 1 – Shops that Closed
Here are some of the connectors used in the above sample answers of the graph that shows the number of shops that closed and the number of new shops that opened in one country between 2011 and 2018:
- As a whole/Overall
- However/Conversely
- Notably
- Subsequently
- Despite
- In summary
- Nevertheless
Enroll into our Free IELTS Webinar and learn more about techniques to improve your IELTS skills to achieve a band 8+.
By mastering the IELTS Writing Task 1, you need to understand the visual data, identifying key trends, and presenting them clearly and logically. Remember that you will be assessed based on your clarity, structure, and task achievement. By diligently practising with different question types, you will build the confidence needed for the IELTS exam and score a higher band score of 8+. With focused strategy and a preparation technique, you will be able to level up your preparation for your desired band scores.
Check More IELTS Academic Writing Task 1
Also Check:
Practice IELTS Writing Task 1 based on report types

Start Preparing for IELTS: Get Your 10-Day Study Plan Today!
Explore other sample Line Graphs


Nehasri Ravishenbagam

Recent Articles

Nehasri Ravishenbagam

Nehasri Ravishenbagam

Kasturika Samanta


Post your Comments