Recent IELTS Writing Task 1 Topics Academic with Model Answers
With the recent IELTS Writing Task 1 Topics Academic with Model Answers, you can prepare for the IELTS exam where you need to compare and contrast the information and make connections between the two.
Table of Contents
- Overview of IELTS Academic Writing Task 1
- IELTS Academic Writing Task 1 Topics with Sample Answers
- Sample 1: IELTS Bar Graph
- Sample 2: IELTS Bar Graph
- Sample 3: IELTS Table
- Sample 4: IELTS Table
- Sample 5: IELTS Pie Chart
- Sample 6: IELTS Pie Chart
- Sample 7: IELTS Process Diagram
- Sample 8: IELTS Process Diagram
- Sample 9: IELTS Multiple Graph
- Sample 10: IELTS Multiple Graph
- Sample 11: IELTS Map Diagram
- Sample 12: IELTS Map Diagram
- Sample 13: IELTS Line Graph
- Sample 14: IELTS Line Graph
- Sample 15: IELTS Bar Graph

Try AI Essay Checker for Instant Band Score
The Academic Writing Task 1 is one of the important sections which appears in the IELTS exam and you can prepare for the same with the recent IELTS Academic Writing Task 1 topics with answers. By exploring these recent IELTS writing task 1 topics academic, you will get yourself familiarised with the structure.
This article focuses on recent IELTS Writing Task 1 topics academic with sample answers, along with an overview of what the task is about.
Overview of IELTS Academic Writing Task 1
In Writing Task 1 of IELTS Academic, you are required to use your own words to describe a graph, table, chart, or other visual information. Let’s look at some more pointers:
- You have to write at least 150 words in 20 minutes for this task. If you don't write at least 150 words, you will lose some score for 'task achievement' as you will not fulfill this marking criterion.
- The marks you receive for Task 1 are half those you receive for IELTS Writing Task 2. As a result, Task 1 in the Writing test is worth 33% of the total score.
- It is important to write in a formal manner while answering the IELTS Academic Writing Task 1.
- The question will always follow the same format. After the instructions and a brief explanation of the graph, there will be the visual (chart, graph, table, etc.).
Types of Academic IELTS Writing Task 1 Questions
There are various types of questions which might appear in the IELTS exam. So, you need to level up your preparation by attempting all types to be well-versed. The question types are:
IELTS Academic Writing Task 1 Topics with Sample Answers
Understanding the type of the graph is essential, as each requires a structure to be evaluated and compared, as well as contrasted the same. Therefore, learn the tricks of writing answers from the IELTS Writing Task 1 topics academic given below.
Sample 1: IELTS Bar Graph
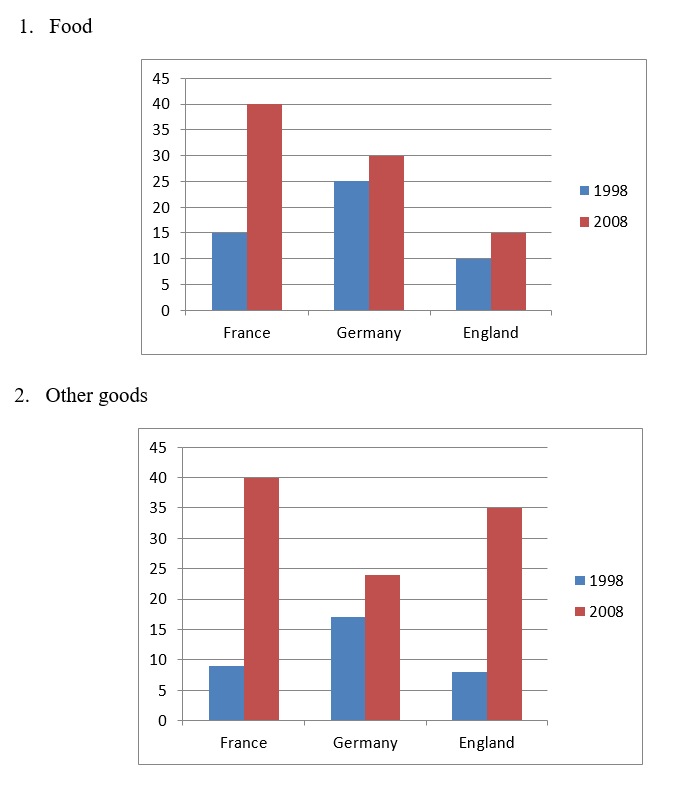
The charts show the percentage of income spent on food and other goods in 3 European countries from 1998 – 2008. Summarise the information by selecting and reporting the main features, and make comparisons where relevant. Write at least 150 words.
Sample 2: IELTS Bar Graph
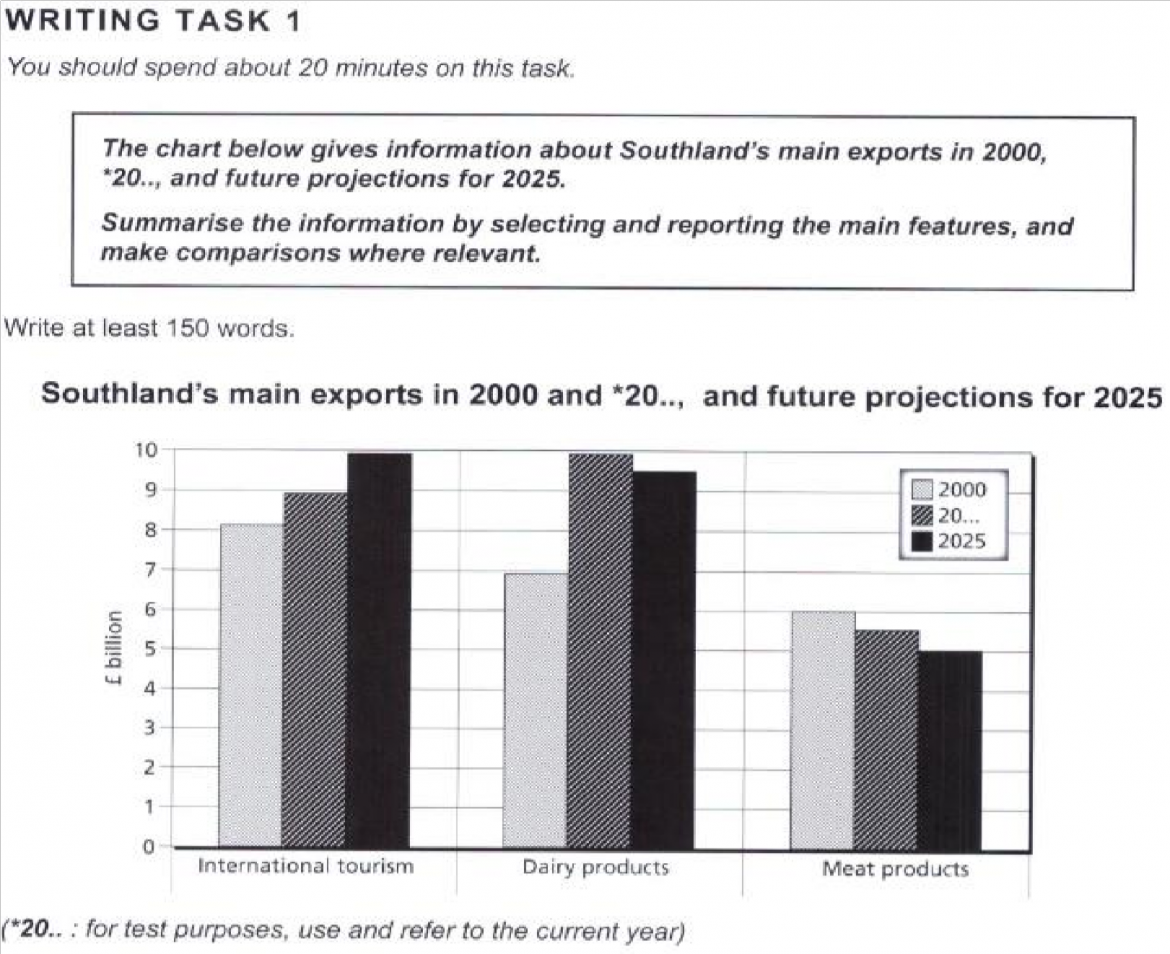
The chart below gives information about Southland’s main exports in 2000, and future projections for 2025. Summarise the information by selecting and reporting the main features, and make comparisons where relevant. Write at least 150 words.
Sample 3: IELTS Table
The table shows the relative amount of GDP that five different countries invested in healthcare services in 2002. Summarise the information by selecting and reporting the main features, and make comparisons where relevant. Write at least 150 words.
| Total | Public spending | Private spending | |
| Japan | 7.20% | 5.80% | 1.40% |
| Italia | 7.70% | 5.30% | 2.40% |
| German | 9.30% | 7% | 2.30% |
| France | 11.40% | 8.60% | 2.80% |
| USA | 8.60% | 6% | 2.60% |
Sample 4: IELTS Table
The table below gives information about past and projected population figures in various countries for different years. Summarise the information by selecting and reporting the main features, and make comparisons where relevant. Write at least 150 words.
Sample 5: IELTS Pie Chart
The pie charts show the average consumption of food in the world in 2008 compared to two countries; China and India. Summarise the information by selecting and reporting the main features, and make comparisons where relevant. Write at least 150 words.

Sample 6: IELTS Pie Chart
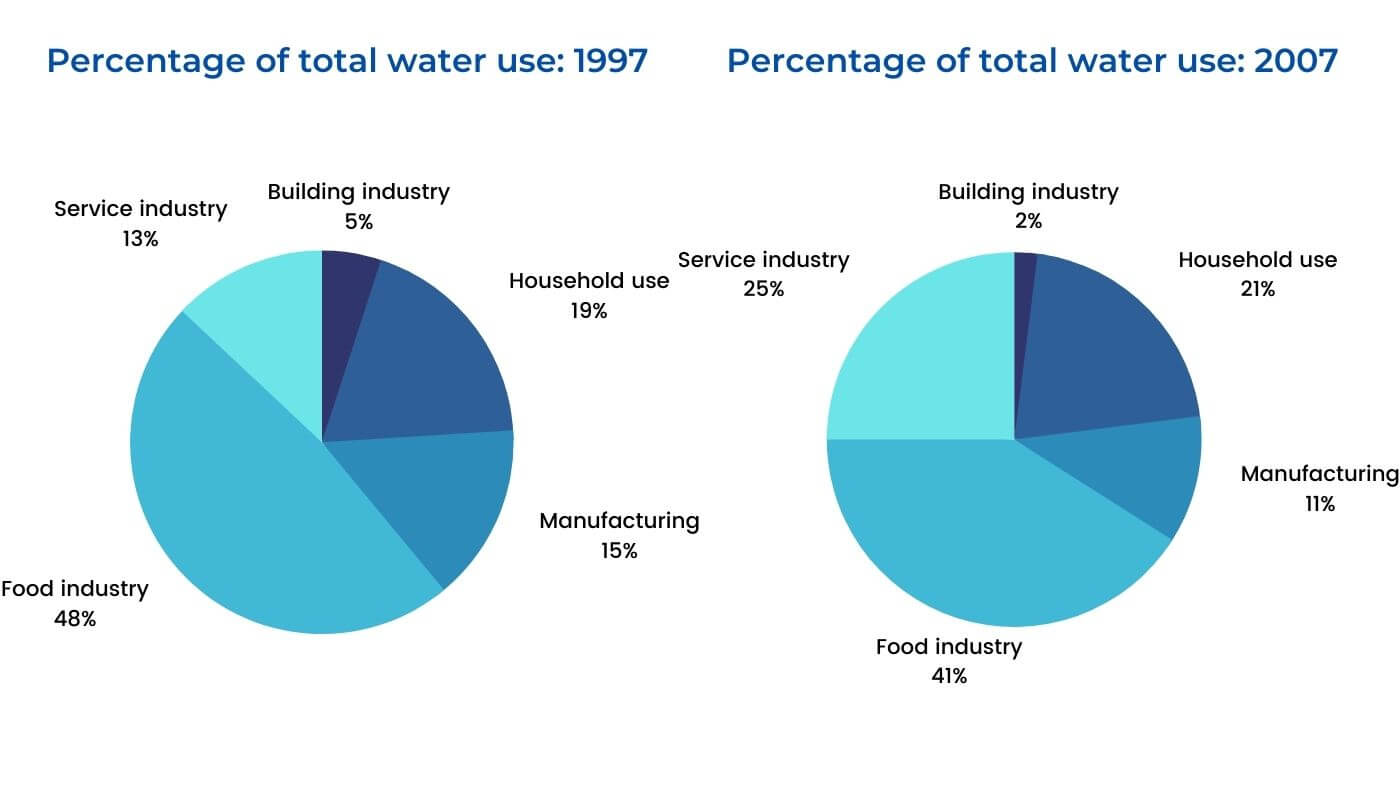
The charts below show the percentage of water used by different sectors in Sydney, Australia, in 1997 and 2007. Summarize the information by selecting and reporting the main features, and make comparisons where relevant.
Sample 7: IELTS Process Diagram
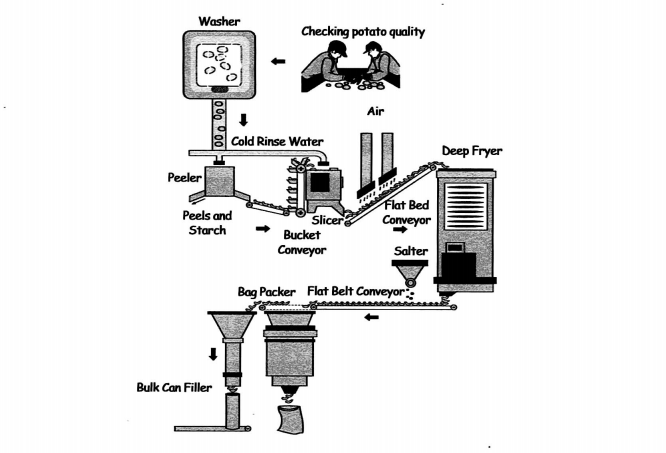
The diagram below shows how potato chips are made. Summarise the information by selecting and reporting the main features, and make comparisons where relevant. Write at least 150 words.
Sample 8: IELTS Process Diagram
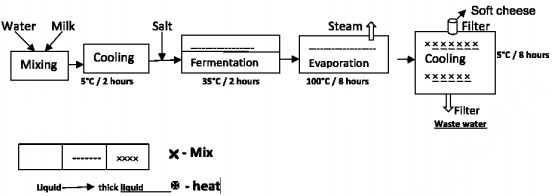
The diagram below shows the process of making soft cheese. Summarise the information by selecting and reporting the main features and make comparisons where relevant. Write at least 150 words.
Sample 9: IELTS Multiple Graph
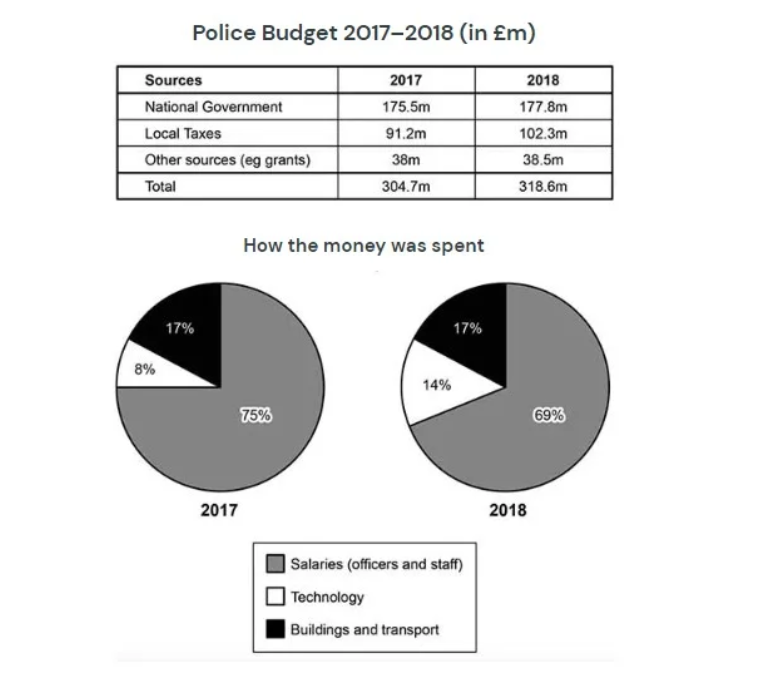
The table and charts below give information on the police budget for 2017 and 2018 in one area of Britain. The table shows where the money came from and the charts show how it was distributed. Summarise the information by selecting and reporting the main features, and make comparisons where relevant. Write at least 150 words.
Sample 10: IELTS Multiple Graph
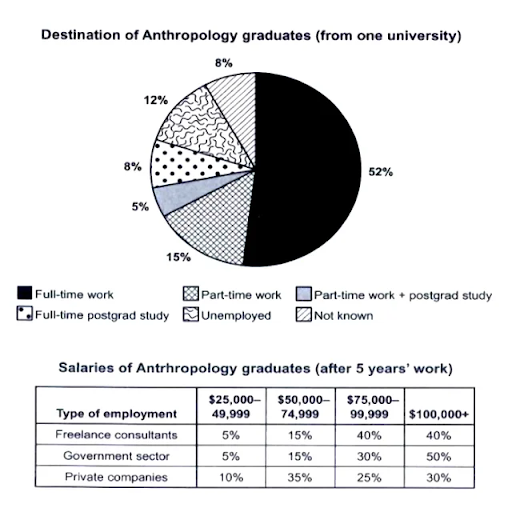
The chart below shows what Anthropology graduates from one university did after finishing their undergraduate degree course. The table shows the salaries of the anthropologists in work after five years. Summarise the information by selecting and reporting the main features, and make comparisons where relevant. Write at least 150 words.
Sample 11: IELTS Map Diagram
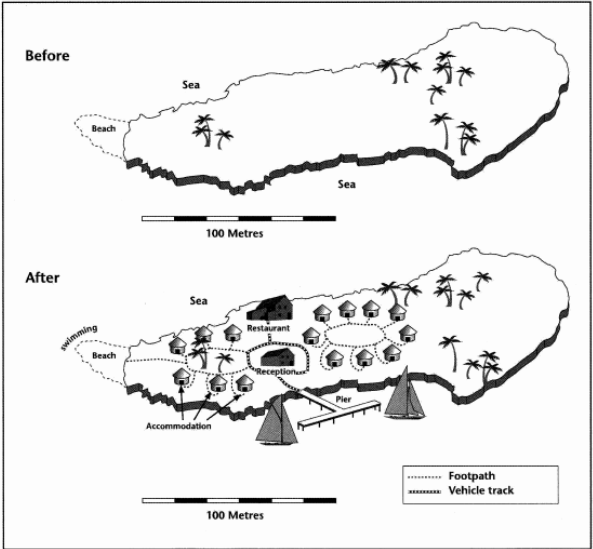
The two maps below show an island, before and after the construction of some tourist facilities. Summarise the information by selecting and reporting the main features, and make comparisons where relevant. Write at least 150 words.
Sample 12: IELTS Map Diagram
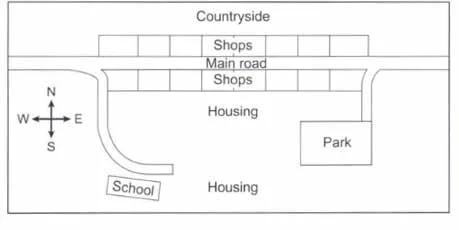
Islip Town Centre Now
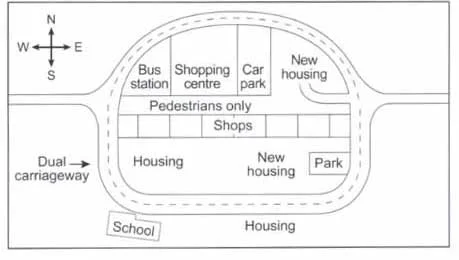
Islip Town Centre: Planned Development
Sample 13: IELTS Line Graph
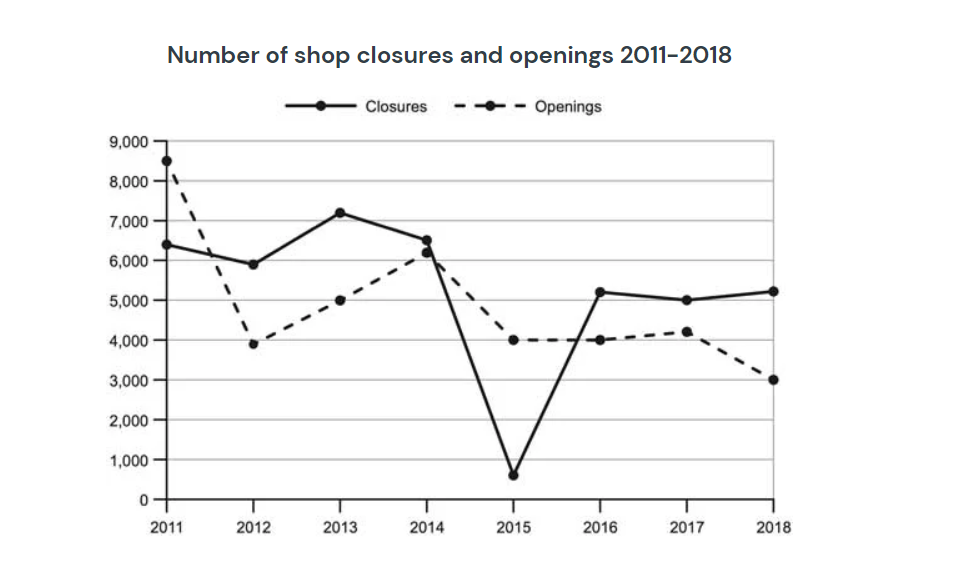
The graph below shows the number of shops that closed and the number of new shops that opened in one country between 2011 and 2018. Summarise the information by selecting and reporting the main features, and make comparisons where relevant. Write at least 150 words.
Sample 14: IELTS Line Graph
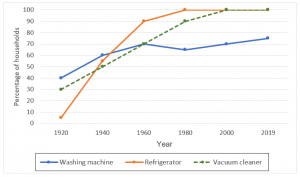
Percentage of households with electrical appliances (1920-2019)
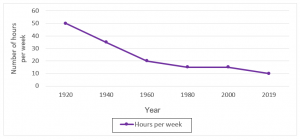
Number of hours of housework* per week, per household (1920 – 2019)
Sample 15: IELTS Bar Graph
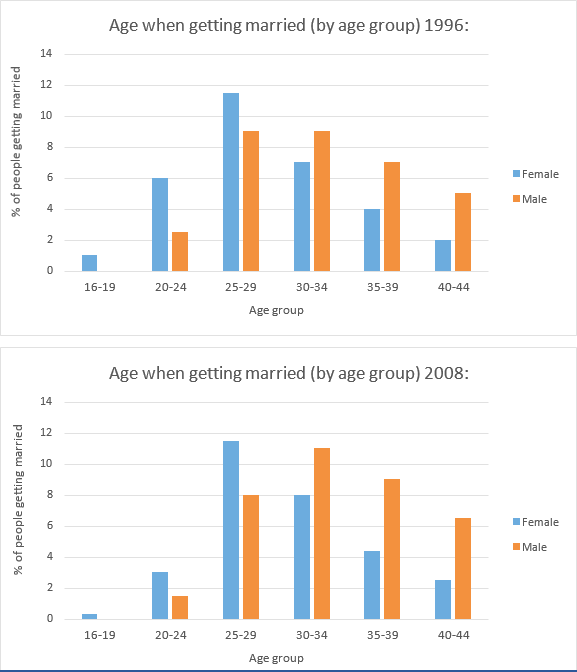
The charts below give information on the ages of people when they got married in one particular country in 1996 and 2008. Summarise the information by selecting and repairing the main features, and make comparisons where relevant. Write at least 150 words.
Also check:
Explore IELTS Writing

Start Preparing for IELTS: Get Your 10-Day Study Plan Today!
Recent Articles
Haniya Yashfeen

Kasturika Samanta




Post your Comments
3 Comments