Explore other sample Pie Charts

Main Reasons Why Students Chose to Study at a Particular UK University – IELTS Writing Task 1 Academic Pie Chart
Table of Contents[Show]QuestionAnswer Structure For IELTS Writing Task 1 Academic Process DiagramBand 7 Sample Answer For Writing Task 1 Question – ‘Main...

6 min read
Updated On
Demand for Electricity in England- Line Graph and Pie Chart
The graph below shows the demand for electricity in England during typical days in winter and summer. The pie chart shows how electricity is used in an average...

2 min read
Updated On
Average Household Expenditures in a Country in 1950 and 2010- Pie Chart
Describe Image is one of the most complicated tasks in the IELTS Writing module. Without a sound plan, it can be difficult to perform well on the Describe Image...
1 min read
Updated On
Methods of Transportation for People Traveling to a University – Pie Chart
Methods of Transportation for People Traveling to a UniversityThis Writing section task type will assess your reading comprehension as well as your writing abil...

3 min read
Updated On
Percentage of Water Used for Different Purposes in Six Areas of the World- Pie Chart
In IELTS Writing task 1 of the Academic section, there will be a visual representation or a diagram on which you have to write a paragraph. One of these visual...
2 min read
Updated On

Online shopping sales for retail sectors in Canada – IELTS Writing Task 1 Pie chart
In Academic IELTS Writing Task 1, pie charts are significant. It can be given as a single one as well as in a combination of two or with other charts and graphs...

2 min read
Updated On

Pie Chart Vocabulary for IELTS Preparation – with Pie Chart Sample Answers, Topics and Tips.
Pie Chart question types are often seen on the IELTS test. In IELTS Writing Task 1 of the Academic section, there will be a visual representation or a diagram o...

7 min read
Updated On
IELTS Academic Writing Task 1: Main Reasons why Agricultural Land Becomes Less Productive
While answering IELTS Academic Writing Task 1, you have to summarize the information that is presented in the form of a graph or a process diagram. The type of...

6 min read
Updated On

IELTS Academic Writing Task 1: Source of complaints about the bank of America
Introduction The sample answers for the IELTS Writing Task 1 on the Source of Complaints about Bank of America are given below. Candidates are encouraged to use...
6 min read
Updated On
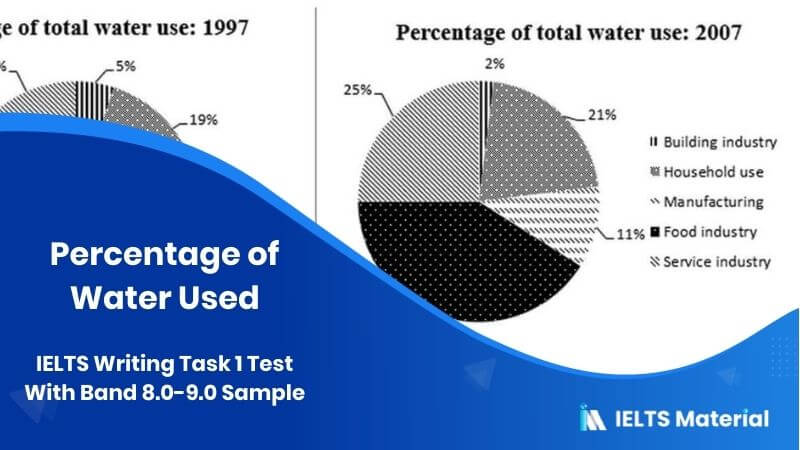
IELTS Academic Writing Task 1 Topic : The percentage of water used by different sectors – Pie chart
Describe Image is one of the most complicated tasks in the IELTS Writing module. Without a sound plan, it can be difficult to perform well on the Describe Image...
2 min read
Updated On
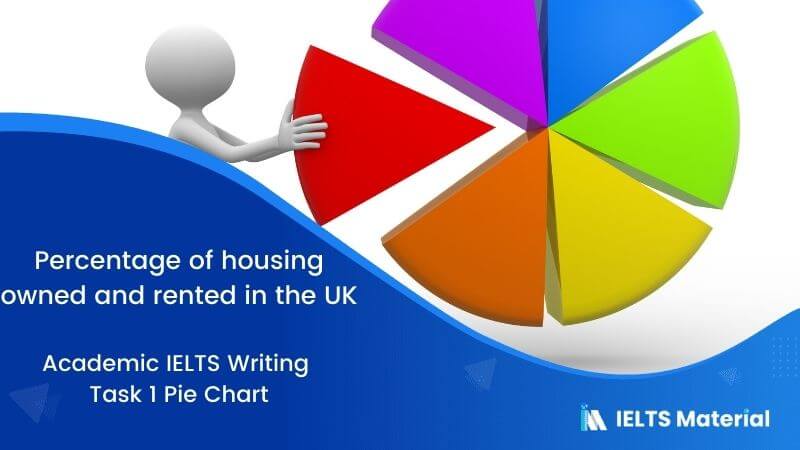
IELTS Academic Writing Task 1 Topic 13: Percentage of housing owned and rented in the UK – Pie Chart
Describe Image is one of the most complicated tasks in the IELTS Writing module. Without a sound plan, it can be difficult to perform well on the Describe Image...
2 min read
Updated On
How Energy is Used in an Average Australian Household- Pie Chart
Describe Image is one of the most complicated tasks in the IELTS Writing module. Without a sound plan, it can be difficult to perform well on the Describe Image...
2 min read
Updated On

IELTS Academic Writing Task 1 Topic : Survey conducted by a university library – Pie chart
In IELTS Writing task 1 of the academic section, there will be a visual representation or a diagram on which you have to write a paragraph. One of these visual...
2 min read
Updated On

IELTS Academic Writing Task 1 Topic 36: Information on UAE government spending in 2000 – Pie chart
A visual representation or a diagram is the subject of IELTS Writing Task 1 in the Academic portion, for which you must write a concise report of around 150 wor...
2 min read
Updated On
Percentage of Food Budget the Average Family Spent on Restaurant Meals- Pie Chart + Line Graph
The charts below show the percentage of food budget the average family spent on restaurant meals in different years. The graph shows the number of meals eaten i...
1 min read
Updated On

Transport and Car Use in Edmonton- Pie Chart + Table
The diagrams below give information on transport and car use in Edmonton.You should spend about 20 minutes on this task.Summarise the information by selecting a...
1 min read
Updated On

Changes in Annual Spending by a Particular UK School- Pie Chart
The three pie charts below show the changes in annual spending by a particular UK school in 1981, 1991 and 2001.You should spend about 20 minutes on this task.S...
1 min read
Updated On
IELTS Academic Writing Task 1 Topic 21: Proportion of different categories of families living in poverty in UK – Pie Chart
The pie chart below shows the proportion of different categories of families living in poverty in UK in 2002.Summarise the information by selecting and reportin...
2 min read
Updated On
IELTS Academic Writing Task 1 Topic 18: Average Consumption of food in the world – Pie Chart
The pie charts show the average consumption of food in the world in 2008 compared to two countries; China and India.Write a report to a university lecturer desc...
2 min read
Updated On

IELTS Academic Writing Task 1 Topic 20: Changes in spending habits of people in UK – Graph
The graphs show changes in spending habits of people in UK between 1971 and 2001.Write a report to a university lecturer describing the data.Write at least 150...
2 min read
Updated On

